 Products Home
Scanning Fabry-Perot Interferometers
- Operating Wavelength Ranges from UV to MIR
- Custom Mirror Coatings from UV to Mid-IR Available
- Controller for Scanning Fabry-Perot Interferometers
SA201B
Voltage Controller
(Sold Separately)
SA210-8B
10 GHz FSR, 820 - 1275 nm
SA200-2B
1.5 GHz FSR, 290 - 355 nm & 520 - 545 nm
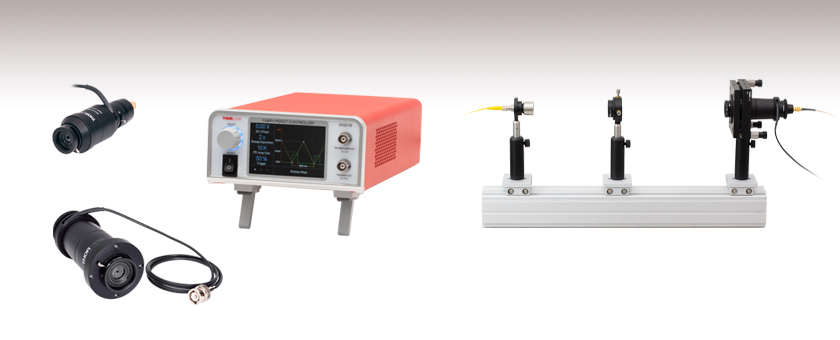
Application Idea
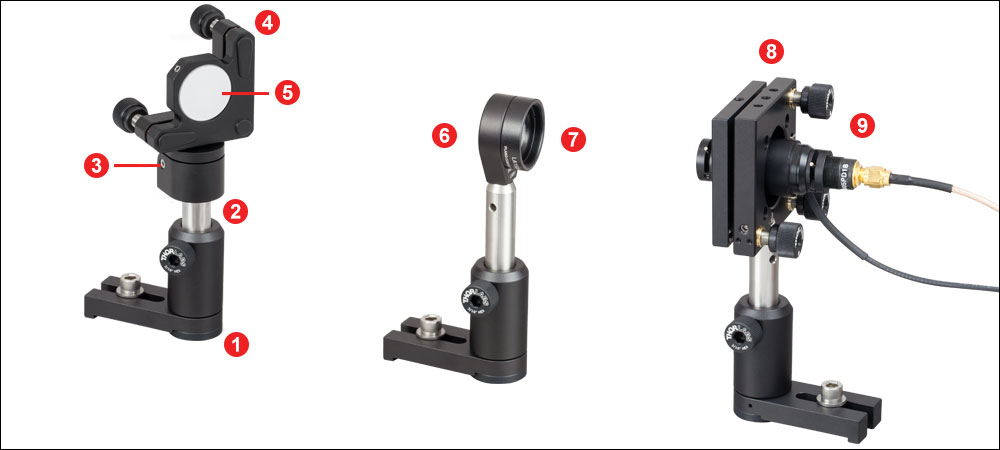
Mounting components on an optical rail system reduces the degrees of freedom while aligning the beam to the cavity. The SA200, focusing lens, and laser are each mounted to an XT66C4 clamping platform which centers the optical axis over the XT66-500 rail axis.


Please Wait
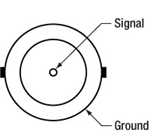
Schematic Representation of a Confocal Fabry-Perot Interferometer
Each Fabry-Perot interferometer features a thermally stable Invar® cavity.
Features
- Analyze Fine Spectral Features of CW Lasers
- Optical Coatings for Wavelengths from 290 nm to 4400 nm (See the Graphs Tab for More Details)
- Free Spectral Range of 1.5 or 10 GHz
- Minimum Finesse Values of 150, 200, or 1500 Available
- Factory-Calibrated Finesse
- Ultrastable Athermal Invar® Cavity
- SMA- or BNC-Coupled for Connection to an Oscilloscope
- SA201B Controller (Sold Separately) Provides Triangle or Sawtooth Scan Voltage for Piezoelectric Transducer
- Custom Mirror Coatings from UV to Mid-IR (Contact Tech Support)
Thorlabs' Scanning Fabry-Perot Interferometers are spectrum analyzers that are ideal for examining fine spectral characteristics of CW lasers. Interferometers are available with a Free Spectral Range (FSR) of 1.5 GHz or 10 GHz. The resolution, which varies with the FSR and the finesse, ranges from <1 MHz to 67 MHz. For information on these quantities and their applications in Fabry-Perot interferometry, see the Fabry-Perot Tutorial tab.
The Fabry-Perot cavity transmits only very specific frequencies. These transmission frequencies are tuned by adjusting the length of the cavity using piezoelectric transducers, as shown in the diagram to the right. The transmitted light intensity is measured using a photodiode, amplified by the transimpedance amplifier in the SA201B controller (or equivalent amplifier), and then displayed or recorded by an oscilloscope or data acquisition card. Each Fabry-Perot interferometer has a cable ending in a BNC connector for controlling the piezo.
The mirrors in the SA30-144, SA200-18C, and SA210-18C interferometers are made of IR-grade fused silica (Infrasil®), the mirrors in the SA200-30C are made of yttrium aluminum garnet (YAG), and the mirrors on all other models are made of UV fused silica. Each Fabry-Perot interferometer also features an internal housing made of thermally stable invar to eliminate misalignment due to temperature fluctuations.
Click to Enlarge
SA200-18C with PDA10PT Detector Installed
Click to Enlarge

Click to Enlarge
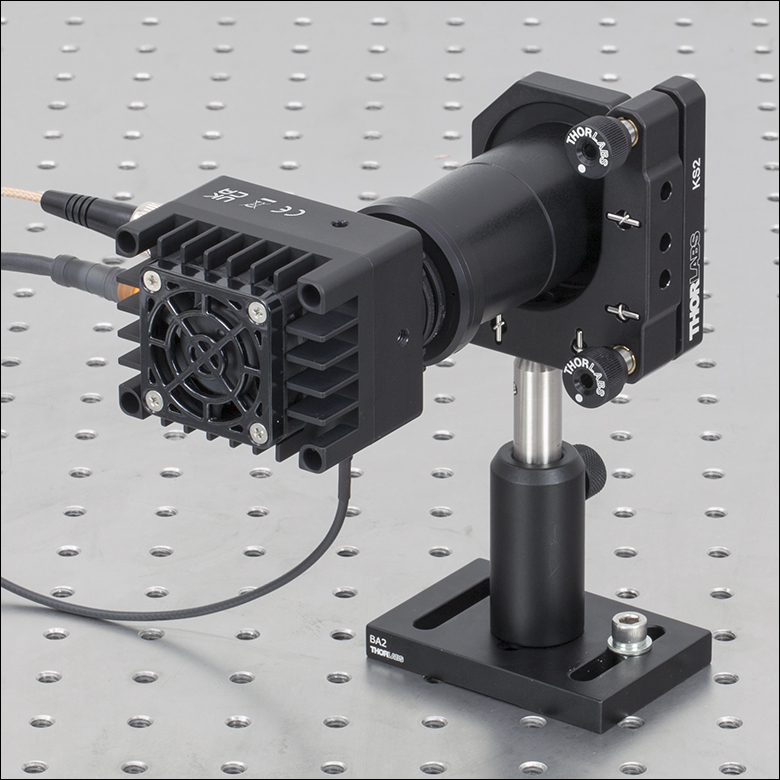
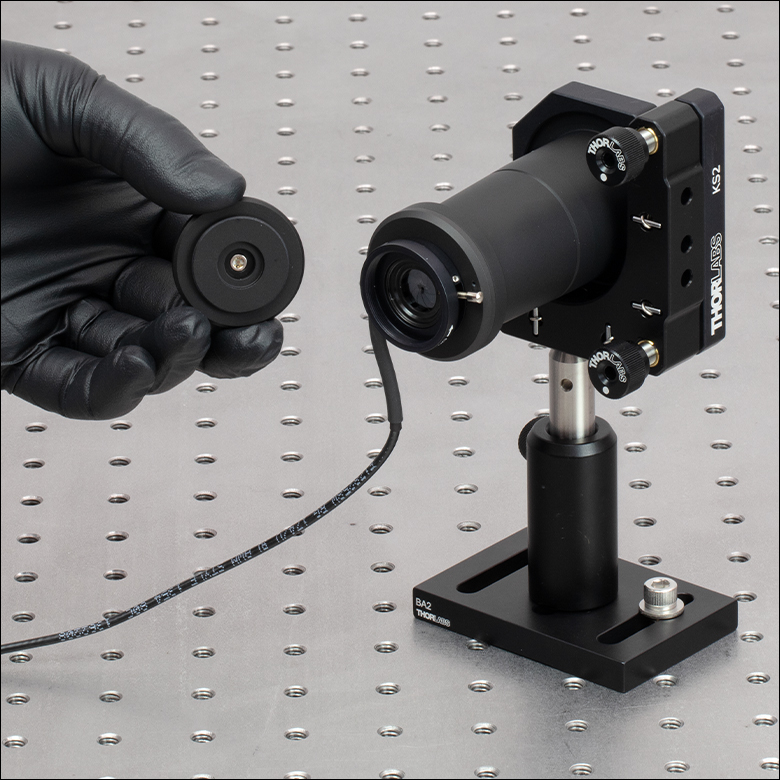
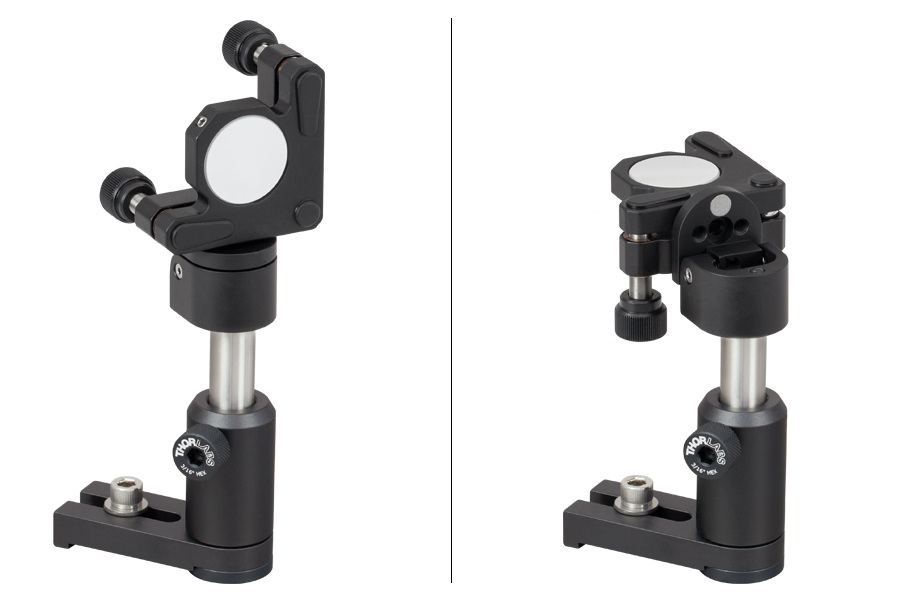
SA200-18C Mounted on KS2 Kinematic Mount
Removal of Detector and Rear Iris
The SA200 and SA30 models feature SM1 (1.035"-40) threading on the back of the instrument for adjustable iris and detector mounting, while the SA210 models include SM05 (0.535"-40) threading. Each Fabry-Perot scanning interferometer comes with lever-actuated iris diaphragms both at the entrance and at the exit of the device. Also, except for the SA200-30C, a photodiode detector is included as well as an SMA-to-BNC cable to connect the detector to an amplifier. To facilitate alignment, the photodetector can be removed by unscrewing it from the rear iris diaphragm; see the Alignment Guide tab or the device manual for more information. The iris diaphragm can also be removed in the same way, but Thorlabs recommends leaving the iris attached during alignment. If needed, the photodiode can also be removed for replacement with another detector.
Alignment
The confocal (SA200/SA210 series) or near-confocal (SA30 series) design of the Fabry-Perot interferometer cavity allows for easy alignment of the input beam. The optical axis of the Fabry-Perot interferometer can be aligned to the input beam with sufficient accuracy by mounting the interferometer on a standard kinematic mirror mount and following the steps on the Alignment Guide tab. An example of our SA200 Fabry-Perot interferometer mounted in a KS2 kinematic mount is shown to the right.
For the SA30 series with a near confocal design, additional steps are necessary to ensure proper alignment of the interferometer. The system will need to be fine-tuned while observing a transmission mode in order to suppress higher order modes. For more details, see the Alignment Guide tab.
Controller
The SA201B controller (sold separately) generates a sawtooth or triangle wave voltage required to repetitively scan the length of the Fabry-Perot cavity in order to sweep through one FSR of the interferometer. The SA201B controller also houses a transimpedance amplifier that can be used to amplify the output of the photodiode detector in the Fabry-Perot interferometer; this detector measures the intensity of the light transmitted through the Fabry-Perot cavity. The controller also provides a trigger signal to the oscilloscope, which allows the oscilloscope to easily trigger at the beginning of the scan, or at a user adjustable location along the scan. The time axis of the oscilloscope can be precisely calibrated by observing two instances of a given spectral feature separated by one FSR (see the Calibration tab for more details). For more information on connecting the Fabry-Perot to the controller and an oscilloscope, see the Connections tab.
The plots below show the reflectance of the mirrors in our Fabry-Perot interferometers. "Mirror Finesse" refers to the contribution to the total finesse value due to the reflectance of the mirrors. In a system with near-perfect alignment, the finesse of the Fabry-Perot cavity will be limited by the reflectance of the mirrors, and the finesse values will approach those shown on the plots below. For more information on finesse, please see the Fabry-Perot Tutorial tab.
Please remember that the actual reflectance of the mirror will vary slightly from coating run to coating run within the specified region and can vary significantly from coating run to coating run outside of the specified region. The total cavity finesse depends on additional factors. Please see the Fabry-Perot Tutorial tab for more information.
Custom mirror coatings for wavelengths from the UV to the mid-IR (200 nm to 4700 nm) are available upon request. If the coatings represented in the graphs below do not suit the needs of your application, please contact Tech Support.
Interferometers with ≥1500 Finesse
Theoretical reflectance and mirror finesse data. The mirror finesse is calculated using Eq. 8 from the Fabry-Perot Tutorial tab. Note that the actual finesse of the instrument will be lower than the curves presented here due to contributions from the substrate surface figure; see Eq. 10 on the Fabry-Perot Tutorial tab.

Interferometers with >150 or >200 Finesse
Theoretical reflectance and mirror finesse data. The mirror finesse is calculated using Eq. 8 from the Fabry-Perot Tutorial tab. Note that the actual finesse of the instrument will be lower than the curves presented here due to contributions from the substrate surface figure; see Eq. 10 on the Fabry-Perot Tutorial tab.


Click to Enlarge
Click Here for Measured Reflectance Data and Calculated Mirror Finesse
This data has been smoothed in the wavelength region from 2.65 - 2.7 µm due to measurement inaccuracies introduced by absorption by water vapor in the air.
| Recommended Beam Sizes and Lenses for FP Interferometers | ||
|---|---|---|
| Item # Prefix | EFLa | Waist Radiusb |
| SA200 | 250 mm | 600 µm (Max) |
| SA210 | 100 mm | 150 µm (Max) |
| SA30 | See SA30 Series Recommendation | |
The sections below outline how to align our Fabry-Perot Interferometers. Use the following links to jump to a specific section:
- General Instructions
- SA30 Series Beam Waist and Lens Recommendation
- Coupling a Free-Space Beam into a Scanning Fabry-Perot Interferometer
- Alignment Procedure
- Additional Alignment Steps for the SA30 Series
Click to Enlarge
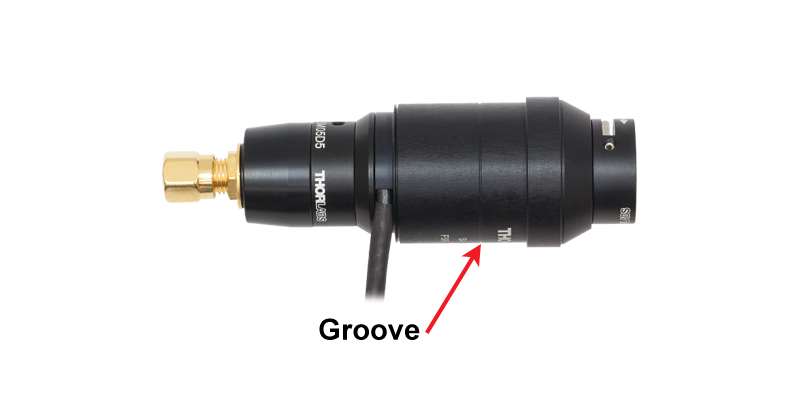
Figure 2: The center of the SA210 interferometer is indicated by a groove on the instrument body.

Click to Enlarge
Figure 1: The center of the SA200 interferometer is indicated by a groove on the instrument body. The SA30 series items have the same instrument body and groove.
General Instructions
The Thorlabs scanning Fabry-Pérot interferometers can be aligned by mounting the instrument in a standard kinematic mirror mount (KS2 for SA200 and SA30, KS1 for SA210), which is then placed in a free-space beam after a fold mirror. While the cavity is being scanned, iteratively adjust the position of the mirror and FP interferometer until the cavity is aligned with the input beam. After the cavity is aligned to the beam, a lens should be placed in the beam so that a beam waist with the specified radius is formed in the center of the cavity, which is marked on the outer housing of the instrument with a groove as shown in Figures 1 and 2.
SA30 Series Beam Waist and Lens Recommendations
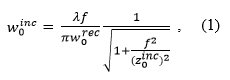
For the SA30 series, the EFL and position of the lens depend on the beam parameters before the lens and have to be chosen in a way to obtain the recommended waist radius. The recommended waist radius of the incident lens is given by

Click to Enlarge
Figure 3: Schematic showing the beam waist incident on the focusing lens, w0inc, and the recommended beam waist, w0rec, at the center of the interferometer body.
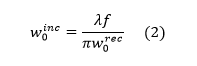
where w0inc, w0rec, z0inc, λ, and f are the waist size of the beam incident on the lens, the recommended beam waist radius at the center of the instrument, the Rayleigh range of the incident beam on the lens, the wavelength of the incident light, and the focal length of the lens. For a well-collimated beam, i.e., when the Rayleigh range of the incident beam on the lens is much larger than the focal length of the lens and the beam is only weakly diverging, Equation (1) reduces to
The lens should be placed at a distance D
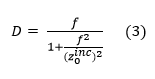
away from the center groove. This reduces to D = f for a well collimated beam1. Please note that the Rayleigh range of a Gaussian beam is given by z0 = πw02/λ, where w0 is the beam waist radius and λ is the wavelength of the incident light.
The recommended waist radius for the SA30 series is given by
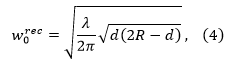
where R is the radius of curvature of the mirrors (50 mm), d is the distance between the two resonator mirrors (50 mm), and λ is the wavelength of the incident beam2.
Coupling a Free-Space Beam into a Scanning Fabry-Perot Interferometer
Click to Enlarge
Figure 4: SA210 FP Interferometer Free-Space System

Click to Enlarge
Figure 5: SA200 FP Interferometer Free-Space System
| Fabry-Perot Alignment Setup Parts List | |||||||
|---|---|---|---|---|---|---|---|
| Callout # | Item # | Qty. | Description | Callout # | Item # | Qty. | Description |
 |
UPH2 | 3 | Universal Post Holder, L = 2.00" |  |
LMR1 | 1 | Lens Mount for Ø1" Optics |
 |
TR3 | 3 | Ø1/2" × 3" Stainless Steel Optical Post |  |
LA1461-A-MLb LA1509-A-MLb |
1 | f = 250 mm Mounted, Visible Plano-Convex Lens (SA200) f = 100 mm Mounted, Visible Plano-Convex Lens (SA210) |
 |
FM90 | 1 | Flip Mount |  |
KC2L KC1 |
1 | Kinematic Cage Mount for 2" Components (SA200) Kinematic Cage Mount for 1" Components (SA210) |
 |
KM100 | 1 | Kinematic Mount for Ø1" Optics |  |
SA200 SA30 SA210 |
1 | Fabry-Perot Interferometer |
 |
BB1-E02a | 1 | Ø1" Broadband Dielectric Mirror | ||||
Click to Enlarge
Figure 6: Flipper Mirror in the Up Position (left) Intercepts Beam and Directs it to Interferometer Setup. Flipper Mirror in the Down Position (right) Allows Beam to Downstream Optics.
Figure 4 above depicts a setup to integrate an SA210 FP Interferometer into a free-space system. Figure 5 shows a similar setup for the SA200. The easiest method for integration is through the use of a flipper mirror and kinematic interferometer mount. The advantage of the flipper mirror is that it allows normal system operation with the ability to measure the source spectrum when necessary, without repositioning optics and equipment. During normal operation, the mirror can simply be flipped out of the way of the beam, allowing the beam unobstructed propagation downstream. When necessary, the mirror can be flipped upright to intercept the beam and pass it down to the interferometer (see Figure 6). The system shown in Figure 4 is a single mirror system; here, the flipper mirror intercepts the beam, which is then directed toward the focusing lens and the interferometer in a kinematic mount. This minimizes space and components required, useful in a compact setup.
The SA210 FP Interferometer is shown mounted in a KC1(/M) (the KS1 would work equally as well) kinematic mount; the SA200 FP Interferometer is shown mounted in a KC2L(/M) (the KS2 would work equally as well) kinematic mount. Figures 4 and 5 show a mounted lens threaded into the LMR1(/M) lens mount (an unmounted lens will work just as well). The specific optics (mirror and lens) will depend on the wavelength of the system.
Alignment Procedure
Measure the height of the beam from the table surface; in general, it is good practice to start with your optics centered at the height of your beam. Install the flipper mirror assembly (mirror mount with mirror, flip mount, post, and post holder) with the mirror in the up position at a 45° angle to the beam. 90° bounces make the initial alignment and walking the beam for fine-alignment much easier. The tapped holes of the optical table make an excellent guide for the initial setup.
With the flipper mirror installed and correctly deflecting the beam by 90°, secure the flipper mirror assembly to the table with a 1/4"-20 (M6) screw. Then mount the interferometer so that the beam enters the center of the aperture; the iris may be used to guide the alignment. While not necessary, if the vertical centerline of interferometer is set at the height of the beam, the initial setup should line up nicely and produce enough of a signal to simply use the kinematic mount of the flipper mirror and the kinematic interferometer mount to guide the beam into its optimal alignment.
Turn on the Fabry-Perot controller box, and start scanning the length of the cavity (set the amplitude at >10 V to ensure that more than 1 peak is displayed) since light will only be transmitted when the cavity length is resonant with the wavelength of the light beam. Connect the detector output and the trigger or ramp signal to an oscilloscope. If no signal is detected at this point, it might be necessary to remove the detector from the back of the Fabry-Perot cavity in order to coarsely align the cavity. The iris located in the back of the interferometer can also be used to guide the alignment. However, this may be unnecessary if care is taken in the initial placement of the optics. Use the kinematic mount holding the interferometer and the flipper mirror to walk the beam until the Fabry-Perot cavity is correctly aligned.
Insert the lens (according to the table above) in the path at the specified distance so that the beam waist is centered in the Fabry-Perot cavity (marked by a groove on the FP housing, see Figures 1 and 2). Adjust the height and position of the lens to center the beam on the entrance aperture. The mirror and interferometer mount can be used to tweak the signal back into its optimal levels.
Additional Alignment Steps for the SA30 Series
Compared to the SA200 and SA210 series interferometers, the SA30 series requires several additional steps in order to properly align the system. After following the alignment steps above, zoom in on a single transmission mode and continue tweaking the alignment for maximum suppression of higher order modes; these higher order modes typically occur within a few MHz of the fundamental transmission mode. To do this, it is convenient to set the oscilloscope to one of the larger transmission modes in the spectrum. The lens position may also need to be adjusted slightly in order to achieve proper alignment and suppress the higher order modes. The images below show examples of transmission spectra before and after fine tuning the alignment for higher order mode suppression.
Please be careful that the output spectrum of the SA201B control box is not affected by the internal filters. The smallest possible time-based FWHM mode width is 4 µs for all gain settings. If you start to approach this value, you either have to change to a lower amplification level or change the PZT settings (amplitude, rise time, or sweep expansion) on the SA201B to achieve a slower sweep.
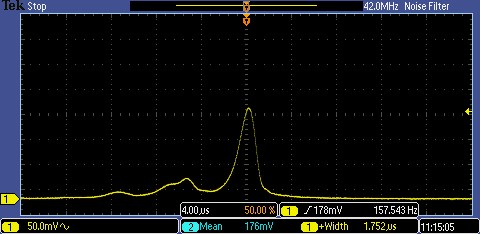
Here, the higher order transverse modes are still visible. This setup requires further tweaking to optimize alignment.
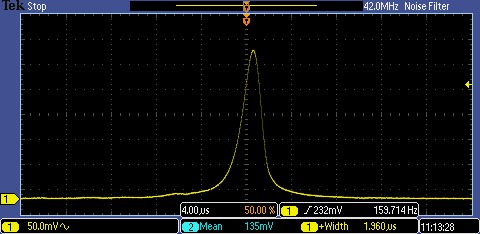
Here, the higher order modes are suppressed. This setup is properly aligned.
References
- P. W. Milonni and J. H. Eberly, Lasers (John Wiley & Sons, Inc., 2010) p. 290.
- H. Kogelnik and T. Li, "Laser Beams and Resonators," Applied Optics, vol. 5, no. 10, 1966.
Connections
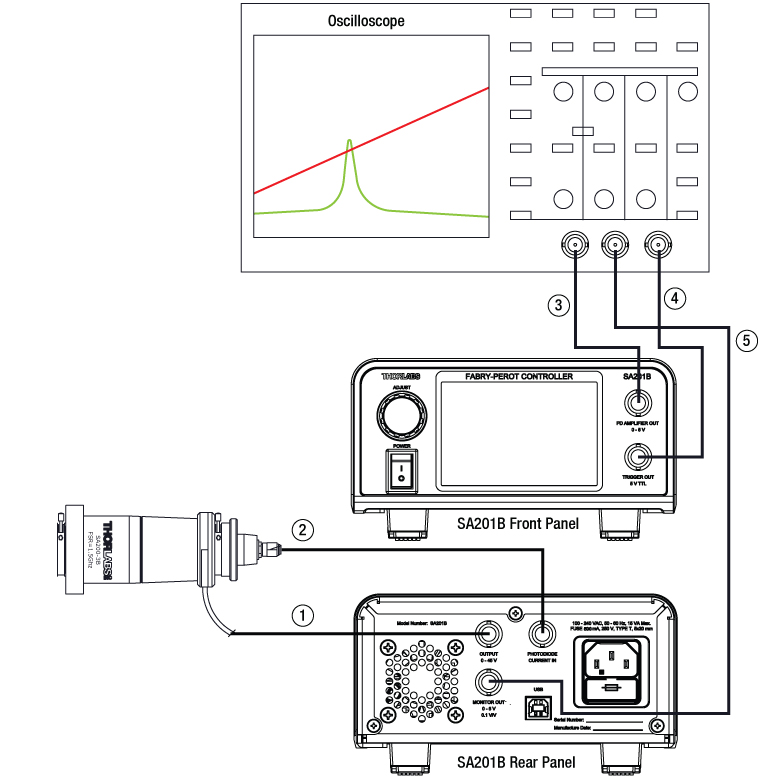
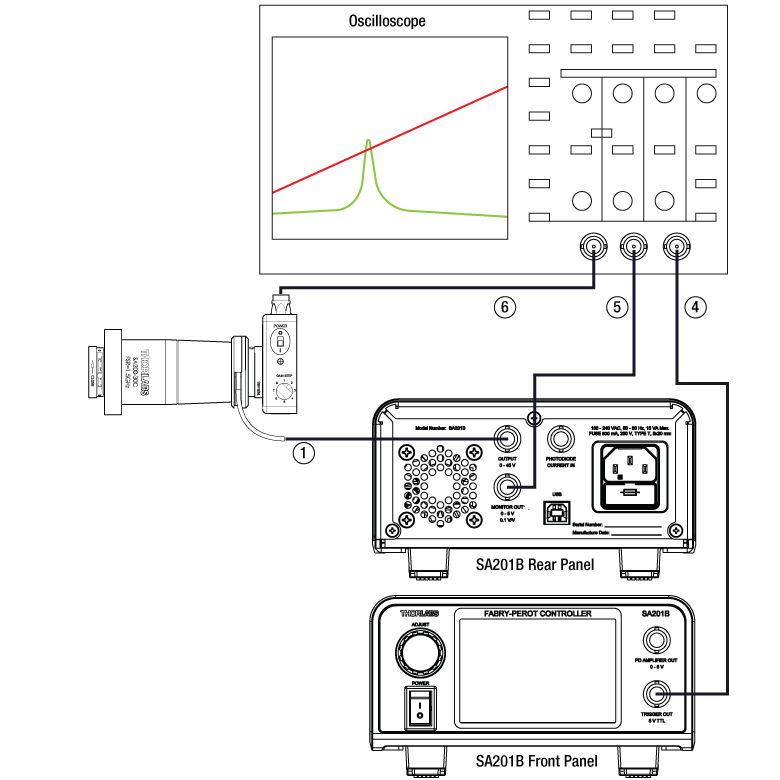
This section describes the electrical connections between a Fabry-Perot (FP) interferometer, an SA201B control box, and an oscilloscope. The SA201B controller provides a voltage ramp to the piezoelectric transducer inside the FP cavity, which controls the cavity length. The oscilloscope is used to view the output from the scanning FP and the controller.
Click to Enlarge
Recommended Setup for SA30, SA200, and SA210 Series Fabry-Perot Interferometers (Except SA200-30C; See Diagram to the Right)
Click to Enlarge
Recommended Setup for SA200-30C Fabry-Perot Interferometer
| Connection | Description |
|---|---|
| 1 | Controller (BNC) to Piezo (Cable is Attached to FP Interferometer) |
| 2a | Photodiode (SMA) to Controller (BNC) (Included with FP Interferometer) |
| 3a | Amplified Photodiode Output (BNC) to Oscilloscope (Not Included) |
| 4 | Trigger Output of Controller (BNC) to Oscilloscope (Not Included) |
| 5 | Optional Connection that Allows the User to Monitor the Signal used to Drive the Piezoelectric Transducers (Not Included) |
| 6b | PDAVJ5 Output (BNC) to Oscilloscope (Detector and Cable Not Included) |
SA30, SA200, & SA210 Series Scanning Fabry-Perot Interferometers
Piezo (Ramp In) - BNC Male
150 V Maximum
Photodiode Out - SMA Female
The SMA to BNC cable is included except for the SA200-30C, which does not include a detector.
SA201 Control Box for Scanning Fabry-Perot Interferometers
PD Amplifier Output BNC
This BNC is the amplifier output and may be connected directly to an oscilloscope to view the cavity spectrum. The amplifier gain will be set using the LCD menu on the front of the control box. The amplifier output includes a 200 Ω series resistor to minimize noise when operating with a 50 Ω coax cable.
Trigger Output BNC Female

This trigger output signal may be used to externally trigger the oscilloscope. The trigger is capable of driving 50 Ω terminated cables, as well as Hi Z loads such as oscilloscopes. The trigger will provide an edge on the beginning of the scanning ramp and at a user adjustable location along the scanning ramp.
Output BNC Female
The output BNC is used to drive the scanning Fabry-Perot interferometers from 1 to 45 V. The output is capable of driving the piezo loads of Thorlabs' Fabry-Perot Interferometers at a ramp rate of 1 ms over the full voltage range. The output current is internally limited to prevent damage to the output drive.
PD Amplifier Input BNC
This input BNC is used to interface the photodetector, provided with the scanning Fabry-Perot interferometers (excluding the SA200-30C), to the amplifier circuit. The photodiode amplifier is configured to operate with the Thorlabs supplied photo detectors; however, it is possible to operate user supplied photodetectors. To do so, the BNC center contact must be connected to the photo detector cathode and the BNC shell must be connected to the photodiode anode (unbiased operation). If a biased detector is to be used, the BNC shell must be connected to the bias ground and the bias voltage must be negative for the circuit to operate properly.
Monitor Out BNC
The monitor out BNC provides an attenuated version of the output ramp signal. The amplifier will attenuate the output drive signal by a factor of 10, so a 45 V signal will output as a 4.5 V monitor level. This is an oscilloscope friendly signal that will typically drive a high impedance load.
Calibrating the Oscilloscope Time Scale
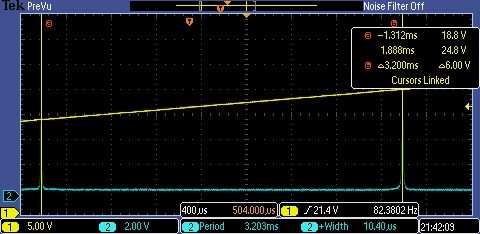 Figure 1: An FSR Plot, Using a 1550 nm DFB Laser (PRO8000 Series). Using the SA200-12B 1.5 GHz interferometer, this plot is used to calibrate the time-base of the oscilloscope. Knowing that the FSR of the interferometer is 1.5 GHz, the calibration factor is found by setting 1.5 GHz = 3.2 ms between the two peaks.
Light transmitted through the Fabry-Perot interferometer can be displayed on an oscilloscope screen by following the setup shown on the Connections tab. Before taking a quantitative measurement for the laser or resonator mode widths, the time scale of the oscilloscope has to be calibrated so results can be determined in terms of optical frequency.
Figures 1 and 2 show the process for manual calibration of the time scale using the SA200-12B 1.5 GHz interferometer. Figure 1 shows the full free spectral range (FSR) of the interferometer (blue), with the two peaks separated by 1.5 GHz, and the linear yellow line indicates the voltage ramp. By measuring the time between the peaks (3.2 ms in this example), the proper calibration can be calculated; 468.8 MHz/ms for our example. Once the time scale calibration is known, we can zoom in on one of the peaks to measure the FWHM in time (shown in Figure 2). The measured FWHM in this example is 10 µs (0.010 ms) and yields a linewidth of 4.7 MHz.
For some of the more advanced oscilloscopes, linewidth and period analysis are automatic. These oscilloscopes will typically display the information somewhere on the screen, as shown in Figure 3 (in this case, the values are displayed at the bottom).
It may be beneficial to express either the FSR or the linewidth in terms of wavelength. The conversion is given by

where δλ is the FSR or linewidth in space, δν is the FSR or linewidth in frequency, λ is the wavelength of the laser, and c is the speed of light. For example, in Figure 2 we have a FSR of 1.5 GHz for a 1550 nm laser. Converting to wavelength, we find that the FSR is 0.0121 nm. Likewise, the linewidth from Figure 3 is 5.1 MHz, which yields a linewidth of 0.000038 nm.
Please note that Thorlabs factory-calibrates the finesse, and a calibration sheet is included with each unit.
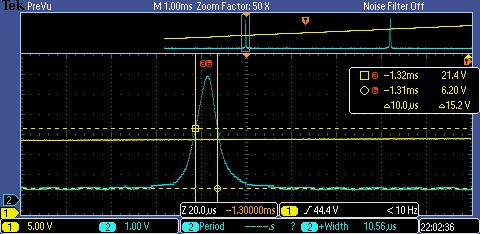
Figure 2: This plot shows a close-up of the actual signal of the laser, which results from the convolution of the laser linewidth and finesse of the cavity; with the oscilloscope timebase calibrated from Figure 1, at 468.8 MHz/ms, we determine the FWHM for the interferometer to be 0.010 ms x 468.8 MHz/ms for a FWHM of 4.7 MHz.
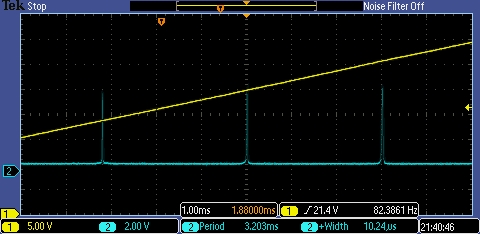
Figure 3: This plot shows an FSR plot on a scope that automatically analyzes pulse width and period. The linear yellow line shows the voltage ramp, the blue line shows the FSR trace.
Scanning Fabry-Pérot Interferometers
Fabry-Pérot interferometers are optical resonators used for high-resolution spectroscopy. With the ability to detect and resolve the fine features of a transmission spectrum with high precision, these devices are commonly used to determine the resonant modes of a laser cavity, which often feature closely-spaced spectral peaks with narrow linewidths.
Spatial Mode Structure
Click to Enlarge
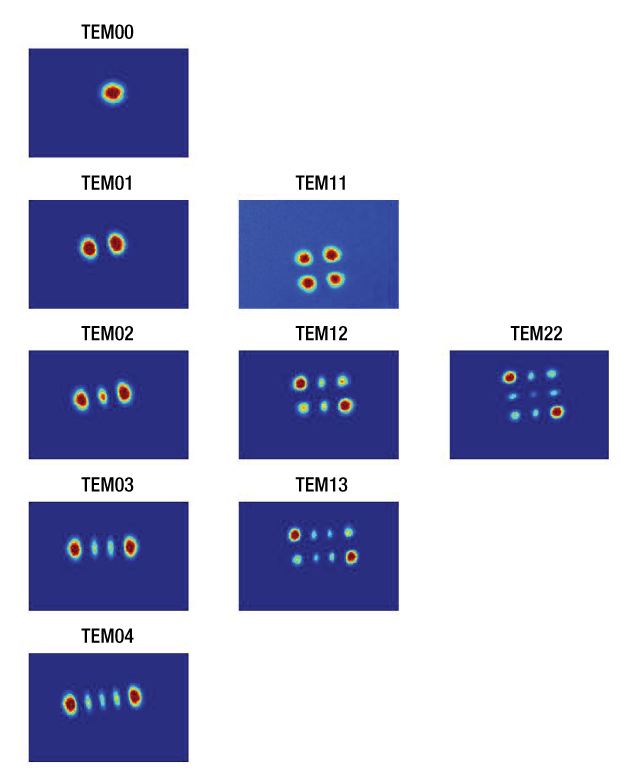
Figure 42A Spatial mode structure for lowest-order TEM modes. Figure reproduced from Further Development of NICE-OHMs.2
The most common configuration of a Fabry-Pérot interferometer is a resonator consisting of two highly reflective, but partially transmitting, spherical mirrors that are facing one another. This type of resonator can be fully characterized by the following set of parameters:
- the resonator length or mirror spacing, L
- the radii of curvature of the input and output mirror, R1 and R2, respectively
- the transmission, reflection, and loss coefficients of the input and output mirror, t1,2, r1,2, and l1,2, respectively, related to each other in such a way that t1,2 + r1,2 + l1,2 = 1 is fulfilled
Light waves entering the resonator through the input mirror will, depending on the mirror reflectivity, travel a large number of round-trips between the two mirrors. During this time, the waves also undergo either constructive or destructive interference. Constructive interference reinforces the wave and builds up an intracavity electric field. This corresponds to the case where a standing wave pattern is formed between the resonator mirrors, which occurs when the resonator length L is equal to an integer multiple of half the wavelength, qλ/2. All other wavelengths that do not fit this criteria are not supported by the resonator and destructively interfere.
By assuming a general Gaussian beam solution to the paraxial wave equation, it can be shown1 that only the following frequencies, νqmn, can exist inside the resonator:

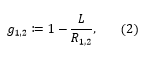
where q, m, and n are mode numbers that can take on positive integers or zero and c is the speed of light. The g-parameters of the resonator g1,2 are given by
where R1,2 > 0 for concave mirrors and R1,2 < 0 for convex mirrors. These frequencies are referred to as Gaussian transverse electromagnetic (TEM) modes of order (m,n), or the Hermite-Gaussian modes, and are typically denoted as TEMm,n. The mode numbers m and n are associated with transverse modes, which describe the intensity pattern perpendicular to the optical axis, while q corresponds to the longitudinal mode. The TEM00 modes with m = n = 0 are called the fundamental TEM modes, or longitudinal modes, while TEM modes with m,n > 0 are called higher-order TEM modes. Figure 42A shows the spatial intensity pattern for a number of modes. Indices m and n correspond to the number of nodes in the vertical and horizontal directions respectively. For the case of light in the near-infrared region, the parameter q is on the order of 106. The g-parameters of a resonator are often found in the so-called stability criterion. A resonator is called stable when its g-parameters fulfill the condition 0 ≤ g1g2 ≤ 1.1
Transmission Spectrum of a Fabry-Pérot Interferometer
Click to Enlarge
Figure 42B Mode spectrum of a Fabry-Pérot interferometer for mirror reflectances of 99.7%, 80%, and 4%, illustrated by a blue, red, and green curve, respectively. 99.7% reflectance corresponds to the case for the SA200 series, which has a free spectral range of 1.5 GHz. The 4% reflectance corresponds to a typical "fringing effect" arising from reflections between parallel surfaces on glass plates.
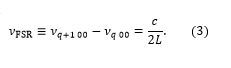
For the case where light is spatially mode matched to the fundamental TEM00 mode, i.e., when the wave fronts of the Gaussian beam perfectly match with the mirror surfaces and the incoming beam is aligned to the optical axis of the resonator, no higher order modes (m,n > 0) are evoked. The transmission spectrum of the resonator consists only of TEM00 modes that differ from each other by different values of the parameter q. The distance between two consecutive TEM00 modes νq00 and νq+1 00 is called the free spectral range (FSR) of the resonator and is given by
This equation holds for all linear resonators comprised of two mirrors. The transmission intensity of a resonator, It, as a function of the frequency detuning from mode q,
Δνq = ν - νq, is given by the well-known Airy-formula3
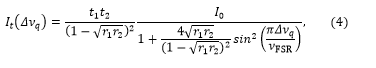
where I0 is the intensity of the light incident on the instrument and all other variables are as described above. Figure 42B shows the typical transmission spectrum of a Fabry-Pérot interferometer. From the above equation it can be seen that the on-resonance transmission, Tcres, is given by
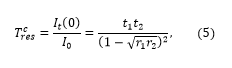
which also makes clear that the on-resonance transmission not only depends on the transmission of a single mirror, but also on the mirror's reflection and loss coefficients, since all mirror coefficients are connected through t1,2 + r1,2 + l1,2 = 1 by definition. One always strives to keep absorption losses as small as possible to obtain maximum transmission for a given set of r1,2.
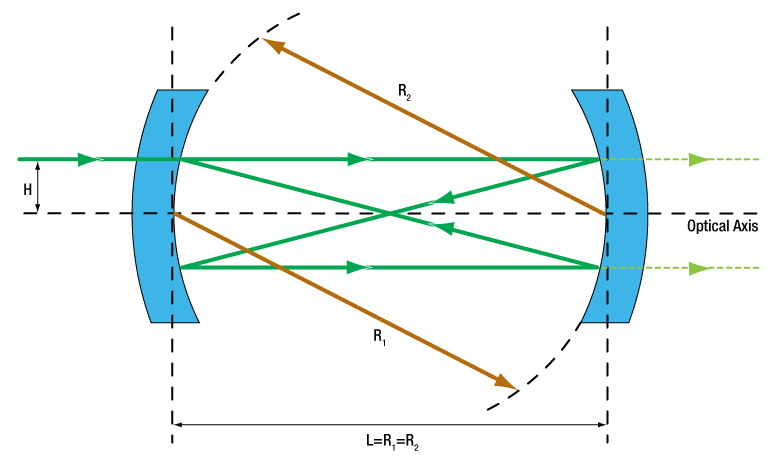
It can be seen from Equations (1) and (2) that the position of higher order transverse modes strongly depends on mirror spacing, L, and the radii of curvature of the mirrors, R1,2. For the special case when the two mirrors have the same radius, i.e. R1 = R2 = R, and the distance between the mirrors is equal to the mirror radius, i.e. L= R, the resonator is called a confocal resonator. Figure 42C shows a typical ray trace for a beam entering the resonator parallel to the optical axis at a distance H. All Thorlabs Fabry-Pérot interferometer models are based on such a confocal resonator design. For such a configuration, Equation (1) above simplifies to
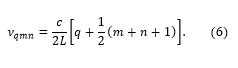
Two important conclusions can be drawn from this equation. First, all modes are degenerate, i.e., there exist higher order TEM modes that share the same frequency as the fundamental TEM00 (e.g. TEMq' 00, TEMq'-1 02, TEMq'-1 11, TEMq'-1 20, TEMq'-2 40, TEMq'-2 31, TEMq'-2 22, … all share the same frequency). Second, the spectrum shows a regular, equidistant mode structure and the spacing between two consecutive modes is given by c/4L. If special care is not taken to obtain spatial mode matching, it is highly unlikely that higher order modes are suppressed. As a result, several higher order modes exist between two consecutive fundamental modes (TEMq00 and TEMq+1 00) and the equidistant spacing between modes makes it appear that this FSR is equal to c/4L. To account for the existence of higher order modes, all values given for the FSR of the Thorlabs Fabry-Pérot interferometers are referring to the so-called confocal free spectral range, νFSR,conf = c/4L. The arrows in Figure 42D highlight the difference between νFSR and νFSR,conf. With careful alignment along the resonator's optical axis and near-perfect spatial mode matching of the incident light, it is possible to extinguish every other mode in the spectrum. Figure 42D below shows a configuration with near perfect mode matching. Higher order modes still exist, but they are smaller than the fundamental modes. Further tweaking of the alignment will eventually distinguish every other mode in the spectrum.
Click to Enlarge
Figure 42C Schematic of a confocal Fabry-Pérot resonator. Mirrors with radius R1 = R2 (brown arrows) are separated by a distance L that is equal to the mirror radius. The solid green lines show a ray-trace of an off-axis input beam entering the resonator at a height H. The dashed light green lines represent the beam transmitted through the second mirror; light transmitted through the first mirror is not pictured.
Click to Enlarge
Figure 42D Spectrum of a confocal resonator with near perfect spatial mode matching, where every other mode is extinguished as only the fundamental mode is excited. The TEMqmn labels represent only one mode contained at that particular frequency; all modes are degenerate and, as described in the text, there are other modes sharing the same frequency.
Finesse and Mode Width (Resolution)
Click to Enlarge
Figure 42E When two Lorentzian lineshapes are separated by their FWHM, they meet the Rayleigh criteria for being resolvable.
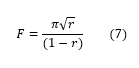
A Fabry-Pérot interferometer's performance, to a large extenta, depends on the mirror reflectivity. Low-reflectivity mirrors will yield broader transmission peaks, while high-reflectivity mirrors will yield narrower transmission peaks. The mirror reflectivity plays a significant role in how well the interferometer can distinguish features of the transmission spectrum. Beyond the free spectral range, two more important quantities of a Fabry-Pérot interferometer are its finesse and mode width. The finesse, F, for mirrors having identical reflection coefficients, r, is given by
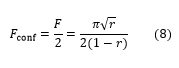
For the case of a confocal interferometer, it can sometimes be convenient to express the finesse as
An interferometer with a higher finesse will produce narrower transmission peaks than one with a lower finesse. Thus, a higher finesse increases the resolution of the interferometer, allowing it to more easily distinguish closely spaced transmission peaks from one another. According to the Rayleigh criterion (see Figure 42E), two identical Lorentzian line shapes are resolvable when the peaks are separated by the full width at half maximum (FWHM) of each peak, denoted as ΓFWHM. The FWHM mode width, also called resolution, is related to the finesse and the FSR of a confocal resonator by
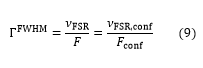
which is a measure of the minimum allowed spacing between two peaks to be resolved. For example, an interferometer with an FSR of 1.5 GHz and a finesse of 250 will have a FWHM of 6 MHz, and thus it will be able to distinguish features of the transmission spectrum as long as the peak values are at least 6 MHz apart. For visible light, this corresponds to a wavelength resolution of about 10 fm (10-14 m).
Thorlabs offers mirrors with crystalline coatings that achieve 99.999% reflection at 1550 nm, which equates to a reflection coefficient of 0.99999 or a finesse of 314 158. An interferometer using these crystalline mirrors would have a resolution of approximately 4.8 kHz, four orders of magnitude finer than the previous example, given the same FSR of 1.5 GHz.
Further Considerations on the Finesse
In fact, a measured finesse has a number of contributing factors: the mirror reflectivity finesse, simply denoted F above, the mirror surface quality finesse FQ, and the finesse due to the illumination conditions (beam alignment and diameter) of the mirrors Fi. The overall finesse of a system, Ft, is given by the relation4
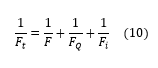
Often, the reflectivity finesse, Equation (8), is presented as an effective finesse, which is true for the case when the other contributing factors are negligible. For Thorlabs' interferometers, the reflectivity finesse dominates when operating with proper illumination.b
The second term in Equation (10) involves, FQ, which accounts for mirror irregularities that cause a symmetric broadening of the lineshape. The effect of these irregularities is a random position-dependent path length difference that blurs the lineshape. The manufacturing process that is used to produce the cavity mirror substrates always has to ensure that the contribution from FQ is negligible in comparison to the specified total finesse of a resonator; in other words, the substrates surface figure should never be the limiting factor for the finesse.
The final term in Equation (10), which deals with the illumination finesse, Fi, will reduce the resolution as the beam diameter is increased or as the input beam is offset. When the finesse is limited by the Fi term, the measured lineshape will appear asymmetric. The asymmetry is due to the path length difference between an on-axis beam and an off-axis beam, resulting in different mirror spacings to satisfy the maximum transmission criteria.
To quantify the effects of the variable path length on Fi, consider an ideal monochromatic input, a delta function in wavelength with unit amplitude, entering the Fabry-Pérot cavity coaxial to the optic axis and having a beam radius a. The light entering the interferometer at H = +e, where e is infinitesimally small but not zero, will negligibly contribute to a deviation in the transmitted spectrum. Light entering the cavity at H = +a will cause a shift in the transmitted output spectrum, since the optical path length of the cavity will be less by an approximate distance of a4/R3. Assuming the input beam has a uniform intensity distribution, the transmitted spectrum will appear uniform in intensity and broader due to the shifts in the optical path length. As a result, the wavelength input delta function will produce an output peak with a FWHM of H4/R3 (Ref. 6).
Click to Enlarge
Figure 42F The total finesse Ft as a function of beam diameter, 2H, for the SA200 and SA210 Fabry-Pérot Interferometers using Equation (12). The finesse is calculated for a wavelength λ of 633 nm.
Assuming that only Fi contributes significantly to the total finesse, then Eq. (9) can be used to calculate Fi for the idealized input beam. Substituting λ/4 for the FSR, and (H4/R3) for FWHM, yields:
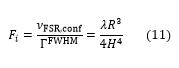
The λ/4 substitution for the FSR is understood by considering that the cavity expands by λ/4 to change from one longitudinal mode to the next. For an input beam with a real spectral distribution, the effect of the shift will be a continuous series of shifted lineshapes. It should be noted that the shift is always in one direction, leading to a broadened or asymmetric lineshape due to the over-sized or misaligned beam.
Now, the total finesse for the case of high reflectivity mirrors (r ≈ 1) can be found using Equation (10), which includes significant contributions from both F and Fi (Note: Fq is still considered to have a negligible effect on Ft):
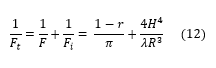
Equation (12) is used to provide an estimate, in general an overestimate, of beam diameter effects on the total finesse of a Fabry-Pérot Interferometer, and several assumptions have been made. The first assumption is that the diameter of the beam is the same as the diameter of the mirror. In practice, the diameter of the beam is typically significantly smaller than that of the mirror, which also helps to reduce spherical aberration.5 A second assumption is that the light is focused down to an infinitesimally small waist size. Even for monochromatic light, the minimum waist size is limited by diffraction, and in multimode applications the waist size can be quite large at the focus. Figure 42F provides a plot of Equation (12) evaluated at 633 nm for the SA200 and SA210 Fabry-Pérot Interferometers, which have cavity lengths of 50 mm and 7.5 mm respectively. The traces in the plot assume that the reflectivity finesse is equal to 250 for the SA200 and 180 for the SA210, which are typical values obtained for mirrors used in our interferometers.
Cavity Ring-Down Time and Intracavity Power Build-Up
As a light wave travels many round-trips inside the resonator, the light is stored inside for a certain amount of time, and only a small portion of its energy leaks out as it impinges on either the input or the output mirror. In other words, the light wave has a certain life-time inside the resonator. This time is called the cavity ring-down time or cavity storage time, τcav, and is given by
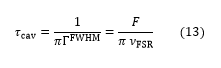
This relation can show that τcav increases with the cavity finesse, i.e., the higher the finesse and the mirror reflectivity, the longer light is stored inside the resonator. In-line with this, another important quantity is the so-called intracavity power build-up, defined by the ratio of the intracavity intensity, Ic, and the incident intensity according to
which is given by F/π for an impedance-matched cavity (i.e., with a vanishing on-resonance reflection). This relates the intracavity intensity to the finesse by
The fact that the power stored inside the cavity increases with finesse has to be kept in mind, when beams with high incident power are evaluated with a Fabry-Pérot interferometer.
Spectral Resolving Power and Étendue
The spectral resolving power of an interferometer is a metric to quantify the spectral resolution of an interferometer, and is an extension of the Rayleigh criterion. The spectral resolving power, SR, is defined as:
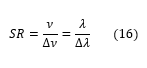
where ν is the frequency of light and λ is its wavelength. It can be shown that for a confocal Fabry-Pérot interferometer, the SR is given by:
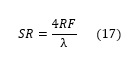
where F is the finesse of the interferometer, R is the radius of curvature of the mirrors, and λ is the wavelength. However, to achieve this maximum instrumental profile while the interferometer is in scanning mode, the aperture of the detector would need to be infinitesimally small; as the size of the aperture is increased, the spectral resolving power begins to decrease. The spectral resolving power must be balanced with the étendue of the interferometer. The étendue (U) is the metric for the net light-gathering power of the interferometer. When the light source is a laser beam, the étendue provides a measure of the alignment tolerance between the interferometer and the laser beam. The étendue is defined as the product of the maximum allowed solid angle divergance (Ω) and the maximum allowed aperture area (A). For the confocal system, the étendue is given by:
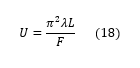
where F is the finesse of the interferometer, λ is the wavelength, and L is the mirror spacing. The spectral resolving power and étendue need to be balanced for the interferometer to work correctly. The accepted compromise for this balance is to increase the mirror aperture until the the spectral resolving power is decreased by 70% (0.7*SR) (Ref. 4). Under this condition the "ideal" étendue becomes π2λR/F, where R is the mirror's radius.
For more information on our Fabry-Pérot interferometers, including typical application examples, please see the full web presentation here.
References
- P. W. Milonni and J. H. Eberly, Lasers (John Wiley & Sons, Inc., 1988) p. 302.
- P. Ehlers, Further Development of NICE-OHMS, Ph.D. thesis, Umeå University, Sweden, 2014.
- D. Romanini et al., in Cavity-Enhanced Spectroscopy and Sensing, edited by G. Gagliardi and H.P. Loock (Springer, 2014), Vol. 179, Chap. 1, pp. 1 - 60.
- M. Hercher, "The Spherical Mirror Fabry-Perot Interferometer," Applied Optics, vol. 7, no. 5, pp. 951 - 966, 1968.
- J. Johnson, "A High Resolution Scanning Confocal Interferometer," Applied Optics, vol. 7, no. 6, pp. 1061 - 1072, 1968.
- W. Demtröder, Laser Spectroscopy, Vol. 1: Basic Principles, (Springer, 2008) p. 152.
Footnotes
- It can be seen from Equation (1) above, that the optical path length and subsequently the free spectral range, finesse, and mode width depend on the beam offset, h, from the optical axis of the interferometer. Hence, best performance is achieved for the beam being well aligned to the optical axis. Also, the radius of curvature of the Gaussian beam impinging on the interferometer should equal the radius of curvature of the mirrors on the corresponding reflective surface. Provided a well collimated beam, this can be achieved sufficiently well by following the lens recommendations in the Alignment Guide tab on our full Fabry-Pérot Interferometers web presentation.
- The reflective coatings in all Thorlabs Fabry-Pérot interferometers have been designed so that the minimum F is better than 1.5 times the minimum specified finesse across their entire operating wavelength range for each model.
Thorlabs Scanning Fabry-Pérot Interferometers can be used in a wide range of applications, of which three examples are presented below. The linewidth measurement examples are valid for a laser emitting a single mode spectrum or an individual mode from a multimode laser with nonoverlapping modes.
Application 1: Determining the Laser Mode Linewidth Through Scanning
As described in the Calibration tab, laser mode linewidth can be measured using an oscilloscope by calibrating the time axis, zooming into the mode, and measuring the full width at half max (FWHM). However, there are three regimes that need to be considered when making this measurement, which are defined by the ratio of the laser line width ΓFWHMlaser to the Fabry-Pérot resonator mode width ΓFWHM.
| Regime | Comments |
|---|---|
| ΓFWHMlaser >> ΓFWHM | This is the preferred mode of operation. The measured FWHM is the laser mode width since the line shape is dominated by the laser linewidth; contributions from the resonator mode width are negligible. |
| ΓFWHMlaser ≈ ΓFWHM | The FWHM extracted from the oscilloscope is a convolution of the laser line shape and the resonator mode. A deconvolution procedure is needed to determine the true laser linewidth. |
| ΓFWHMlaser << ΓFWHM | The line shape is dominated by the resonator mode width; therefore the measured FWHM is the resonator mode width. In this case, for an assessment of the laser linewidth, a Fabry-Pérot resonator with a higher finesse must be chosen. Another possibility is to make an estimate of the linewidth with the so called side-of-mode technique described in Application 2. |
Application 2: Determining the Laser Mode Linewidth Through Side-of-Mode Locking
An estimate for the laser linewidth can be determined by knowing the slope of the Fabry-Pérot resonator mode and measuring the intensity fluctuations that occur when the laser and resonator modes are offset from one another. This technique should be used in cases where the laser linewidth is much less than the Fabry-Pérot resonator mode width. For example, if a laser has a 500 kHz linewidth, it will be difficult to determine the linewidth using an SA200, which has a 7.5 MHz mode width. Note that the measurement described in this section cannot be done with the SA201B controller, which does not provide a pure DC output. Instead, a low-noise PZT driver that is able to provide a constant and stable DC output, e.g. the MDT694B Single-Channel, Open-Loop Piezo Controller, should be used.
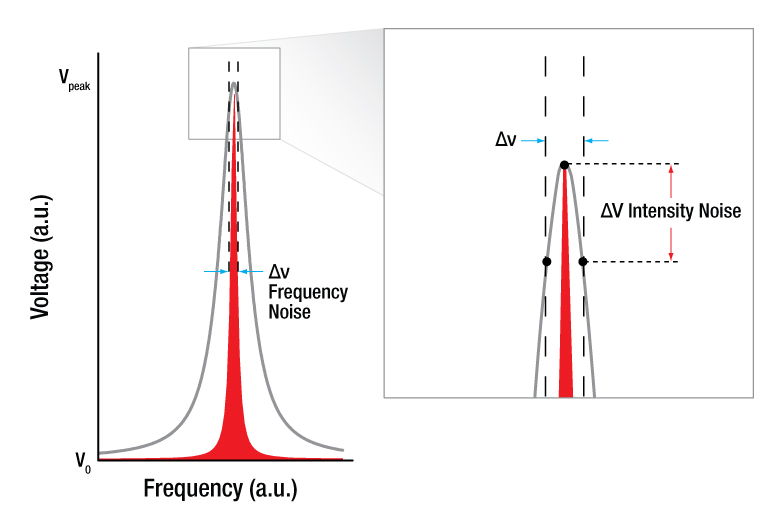
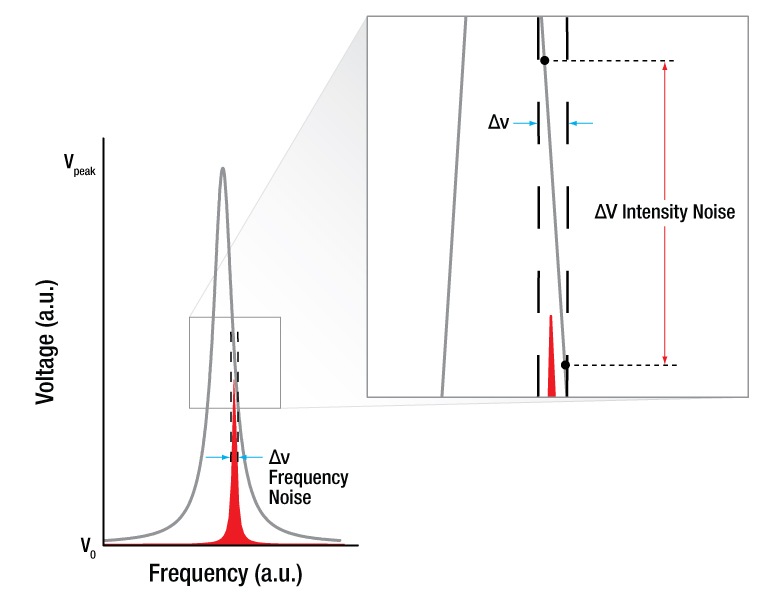
The illustrations below show the origin of the intensity noise used in this technique. In Figure 1, the laser (red) is tuned to the center of the Fabry-Pérot resonator mode (gray). The laser inherently has frequency noise Δν, defined by the FWHM, and as a result the intensity of the light transmitted through the interferometer fluctuates. The black dotted lines drawn from the FWHM of the laser up through the Fabry-Pérot cavity mode profile show that fluctuations in the frequency (blue arrows) lead to small amounts of noise in the intensity (red arrow). For the same amount of frequency noise Δν, a laser tuned to the side of the resonator mode will produce a larger amount of intensity noise ΔV, as shown in Figure 2.
Click to Enlarge
Figure 1: Illustration of frequency-to-noise amplitude conversion. Frequency noise Δν (blue arrows) creates a small amount of intensity noise ΔV (red arrow) when the laser is tuned to the center of the resonator mode. The gray and red peaks illustrate the Fabry-Pérot resonator and laser modes respectively.
Click to Enlarge
Figure 2: Illustration of frequency-to-noise amplitude conversion. The same frequency noise Δν (blue arrows) from Figure 1 creates larger intensity noise ΔV (red arrow) when the laser is tuned to the side of the resonator mode. The gray and red peaks illustrate the Fabry-Pérot resonator and laser modes respectively.
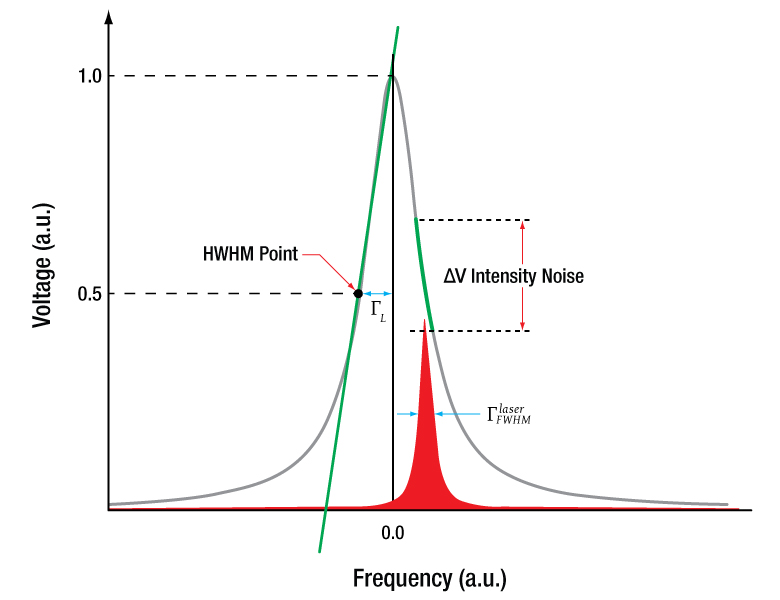
Because the laser is tuned to the side of the Fabry-Pérot cavity mode, it is possible to estimate the linewidth by relating the voltage fluctuations to the slope of the cavity mode. Figure 3 shows a visual representation of this relationship; the green lines indicate the two slopes that are assumed to be equal for this calculation. The Fabry-Pérot resonator mode has a Lorentzian line shape1
Click to Enlarge
Figure 3: Illustration showing the relationship between the slope of the Lorentzian Fabry-Pérot resonator mode profile and the intensity noise. The gray, red, and green lines represent the Fabry-Pérot resonator mode, laser mode, and slope respectively. The blue arrows indicate the frequency noise ΓFWHMlaser (Δν from Figure 2), while red arrows highlight the intensity noise ΔV.
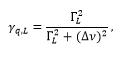
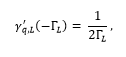
where ΓL is the half-width-at-half-maximum (HWHM) of the mode and Δν is ν-νq. By taking the first derivative of the lineshape, the slope γ’q,L of the resonator mode at the HWHM point (point in Figure 3) can be found to be
The ΓL of the Fabry-Pérot resonator can be calculated by ΓFWHM/2, which refers to equation (8) on the Tutorial tab and is also given in the specifications for all Thorlabs Fabry-Pérot interferometers. The linewidth (FWHM) of the laser, ΓFWHM laser, can be found by taking
where ΔV is the intensity variation that can be determined from the oscilloscope reading, γ'q,L(-ΓL) is the cavity mode slope a the HWHM point, and the factor C accounts for an estimate of the relationship between the peak-to-peak value and the root-mean-square of the noise type present in the measurement. For white noise, the C factor is found to be sqrt(2). It should be noted that the C factor results in an overestimate of the linewidth of the laser, so the calculated linewidth will never be smaller than the actual physical value.
Application 3: Measuring Mode Spectra
As a high-resolution spectrum analyzer, the scanning Fabry-Pérot interferometer is a useful tool for monitoring the performance of a laser. In a manufacturing environment, it could be used during production to ensure side modes are sufficiently suppressed or desired modulation depths are obtained. The Fabry-Pérot interferometers can also be used in an educational setting, specifically as a method to observe HeNe resonator modes while a HeNe laser is warming up, as well as to determine properties such as the free spectral range (FSR) and the actual resonator length inside the HeNe.
To demonstrate the importance of choosing an interferometer with an FSR larger than the laser mode spectrum, Figures 4 and 5 below show simulated HeNe spectra of an unpolarized HNL100RB laser and how they would be detected by SA210-5B and SA200-5B interferometers respectively. With a ~1.3 GHz gain profile, the HeNe laser spectrum is better viewed on the SA210-5B, where the spectrum is sensed by two consecutive modes of the Fabry-Pérot resonator that are spaced out by 10 GHz. The individual modes are shown in gray, while the red dotted line in the figure indicates the laser gain profile. Please note that the red dotted line has been included to highlight the envelope of the gain profile but will not be visible on the scope. In contrast, when viewed on the SA200-5B that has a 1.5 GHz free spectral range, the laser mode profiles overlap. Since the line indicating the gain profile will not be visible on the oscilloscope, it is difficult to distinguish an individual laser spectrum from the neighboring spectra. This is a result of the gain profile being larger than the free spectral range of the scanning Fabry-Pérot Interferometer. Note that the dashed black line in Figure 4 shows a possible gain threshold, and only modes above this threshold will lase and appear in the spectrum. When the laser is warming up, the HeNe resonator expands due to thermal expansion, changing the resonator's resonance frequencies. As a result, the modes under the gain profile will move, becoming stronger towards the center and vanishing when they fall below the threshold.
Click to Enlarge
Figure 4: Simulation showing two consecutive modes of the SA210-5B detecting the mode spectrum of a HeNe laser with a ~1.3 GHz gain profile. With a 10 GHz FSR that is much larger than the gain profile, the laser spectra do not overlap. The dotted red, solid gray, and dotted black lines correspond to the gain profile, longitudinal modes, and gain threshold respectively.
Click to Enlarge
Figure 5: Simulation showing consecutive modes of the SA200-5B detecting the mode spectrum of a HeNe laser with a ~1.3 GHz gain profile. With a 1.5 GHz FSR, the observed laser spectra overlap with one another, making it difficult to extract information. The dotted red, solid gray, and dotted black lines correspond to the gain profile, longitudinal modes, and gain threshold respectively.
References
- N.Ismail, C.C. Kores, D. Geskus, and M. Pollnau,"Fabry-Pérot resonator:spectral line shapes, generic and related Airy distributions, linewidths, finesses, and performance at low or frequency-dependent reflectivity," Optics Express, vol. 24, no. 15, 2016.
Software
Version 1.3.0 (April 23, 2025)
The software package contains the Scanning Fabry-Perot Control Software and the Thorlabs Device SDK.
| Minimum Computer Requirements | |
|---|---|
| Operating System | Windows 7 64-bit (or later) |
| Other Software | Microsoft .NET 4.5 (or later) Microsoft Visual Studio for SDK Demo |
Software for SA201B Control Box
Thorlabs offers a Windows GUI application software which allows the SA201B Fabry-Perot controller to be controlled remotely via computer. A Software Development Kit (SDK) also comes with the device, allowing for the integration of the Fabry-Perot controller into other applications.
| Posted Comments: | |
user
(posted 2025-03-14 09:55:07.067) Hello, would it be possible to purchase the cavity mirrors of the SA200-3B separately?
Thanks! eeklund
(posted 2025-03-17 02:58:00.0) Thank you for reaching out to Thorlabs! We will contact you via email to discuss your application. Steven Huang
(posted 2025-02-12 16:48:44.623) To whom it may concern,
Do you have a module that could operate to FSR=20GHz? acanales
(posted 2025-02-13 07:11:47.0) Thank you for reaching out! Our SA series is designed with a free spectral range (FSR) of 1.5 GHz and 10 GHz. However, if you need a higher FSR, our FPQFA and FPQSA series offer an FSR of 30 GHz. I have contacted you directly to discuss the specific requirements of your application. user
(posted 2025-01-27 20:23:54.64) We are looking to characterize an EOM with a frequency of 9.2 GHz using the SA30-95 FP cavity from Thorlabs. According to Thorlabs, the SA30-95 model specifies a scanning range of 2.6 V per FSR.
Could you kindly provide clarification on the following points:
1. What is the maximum scanning range of this cavity (total ramp voltage to frequency range)?
2. Would this cavity be suitable for characterizing an EOM with a frequency of 9.2 GHz?
Thank you in advance. Your guidance will help us move forward efficiently.
Best regards,
Poonam Yadav acanales
(posted 2025-01-28 07:08:18.0) Thank you for reaching out to us!
1. The piezos in SA30 have a max distance range of 9.5 µm ± 15% @150 V.
2. If would like a setup similar to the one described in our website (https://www.thorlabs.com/newgrouppage9.cfm?objectgroup_id=3918&tabname=lab%20facts) with a modulation of 9.2 GHz, please consider a Fabry Pérot with FSR of at least 10 GHz (SA210). It would be even better to consider the FPQFA since it has a higher FSR of 30 GHz.
I have contacted you directly to discuss your application in detail. Yi Fang
(posted 2025-01-09 01:34:35.337) Dear Thorlabs,
It can be observed that the distance between 1st peak and 2nd peak is not the same as between 2nd peak and 3rd peak in Fig.3 in the "calibration" tab. How to avoid the effect of the small non-linearity caused by hysteresis of piezo-electric actuators
Best,
Fang Yi fnero
(posted 2025-01-13 02:04:28.0) Thank you for your question. There will be a small difference in the distance between the peaks, as you point out. To limit this error it can be an advantage to take the average of two distances between the peaks. We have reached out to you directly to discuss your application more in detail. user
(posted 2024-12-27 21:04:04.63) Hi,
We need to characterize EOM of 9.2 GHz. What will be the better option for us either 10GHz or 1.5 GHz FSR?
Thanks in advance! srydberg
(posted 2024-12-30 03:49:43.0) Hi, thank you for your question! We have contacted you to discuss your application. user
(posted 2024-10-24 16:56:42.467) Hello,
I was wondering if it was possible to order/have a 10GHz SFPI with an interchangeable detector. I can see that it is fairly simple with the 1.5GHz design, but not a higher FSR model.
In addition, it might be a stretch to ask if it is possible to facilitate higher FSR with comparable spectral scanning speeds. A good example would be a 15GHz confocal SFPI that would take no longer than 15ms to scan its range.
Thanks. acanales
(posted 2024-10-29 04:46:28.0) Thank you for contacting Thorlabs! The detectors on all the Fabry-Pérots can be changed by unscrewing them. The scanning range and speed depend on the controller you use. We have contacted you to discuss custom options for your application. user
(posted 2024-10-22 23:06:06.077) Hello,
I am looking for high-extinction narrow-band notch filters. Does the reflection dip of these FP interferometers have high extinction as well (e.g. >40 dB)? eeklund
(posted 2024-10-23 09:58:20.0) Thank you for contacting us! We have contacted you directly to further discuss your application. Richard Spencer
(posted 2024-09-12 14:44:34.323) For the Scanning Fabry-Perot Interferometers, how suspectable are these to vibrations? Would a floating table be necessary or even recommended? acanales
(posted 2024-09-13 05:45:05.0) Thank you for contacting Thorlabs! A floating table is not necessary for our Fabry-Pérot interferometers. A sturdy table with strong mechanics will suffice. For increased mechanical stability and easier alignment, you can use XT66SD or XT95SD rails instead of mounts with long posts. We have contacted you to discuss your application further. Jin Zhao
(posted 2024-05-13 15:34:33.34) Hello Thorlabs, I would like to use the SA200-5B as a filter. If spatially collimated light is input, can the SA200-5B output collimated light filtered within my wavelength range of 590-595nm? Is the spacing between filtered modes approximately 10pm? And does the transmittance of the filtered modes approach 100%? Best regards, Jin. user
(posted 2024-02-15 10:00:13.447) What is the maximum frequency at which I can drive the piezo? acanales
(posted 2024-02-16 06:11:16.0) Hi Jelte, thank you for contacting us! We have not tested the maximum driving frequency since it will depend on the device and voltage range. The measurements shown in the manual and the website are taken with frequencies between 5-50Hz. You can contact Tech Support to discuss your application. Jens LaSSEN
(posted 2024-02-07 16:08:28.53) would there be a chance to use my own optics in the SA200's
would there be an upgrade path to a 300MHz scanning FPI? acanales
(posted 2024-02-09 07:22:25.0) Thank you for your feedback! We have reached out to you to discuss your application more in detail. Soumya Chakraborty
(posted 2023-12-15 09:52:17.483) Hello Thorlabs,
For the product SA200-5B, could you please tell me the dynamics range of the sensitivity of the photodiode used?
Best regards,
Soumya fnero
(posted 2023-12-22 02:21:26.0) Hello Soumya, thanks for reaching out to us. The photodiode used in the SA200-5B is SM05PD1B, the specification for this photodiode can be found on the photodiode page. Jeremie M
(posted 2023-10-31 15:24:53.22) Hi, suppose I want to use the SA210-3B to make spectra of a laser whose centre wavelength can be set between 500 and 502 nm. In that case, all I have to do is adjust the DC voltage, right?
So it's conceivable that a full spectrum could be produced with high resolution in the 350-535 nm range by adjusting the DC voltage? srydberg
(posted 2023-11-01 07:55:44.0) Hi, thank you for your question!
We have contacted you directly to discuss your application. Guanchen Peng
(posted 2023-10-20 16:38:20.42) Hi,
It is generally working very well, but I found it was not able to be scanned yesterday. I measured the input impedance, which turned out ot be 10ohm. Any suggestion on how to fix it?
Regards,
Guanchen srydberg
(posted 2023-10-20 08:12:34.0) Hello, thank you for contacting Thorlabs! We have contacted you directly to troubleshoot this issue. user
(posted 2023-09-27 11:31:05.693) We are currently trying to improve the transmittance of SA210-12B by matching the input light mode.
I have the following three questions
(1) Do the back surfaces of the two mirrors (the surfaces without reflective coating) each have the same curvature? Or are they flat? Also, what is the radius of curvature of the back surface of each?
(2) I would like to know the thickness of each of the two mirrors.
(3) What is the possible difference in reflectance between the two mirrors? fnero
(posted 2023-09-28 05:19:28.0) Thank you for contacting Thorlabs! We have reached out to you directly to discuss your application and answer your questions. Rachel Jones
(posted 2023-06-14 13:16:08.08) Hi thorlabs,
In the manual for the SA30-144 it suggests that removing the PD on the back of device can help aid in the alignment process. Could you please tell me what size allan key I need to remove the PD? I could not find this in the tecnical drawing. mkarlsson
(posted 2023-06-15 07:16:18.0) Hi Rachel, thank you for your question! The PD is not fastened with a hex screw but can be unscrewed by hand. The hex screw you might be referring to belongs to the aperture. Daniel Hickstein
(posted 2023-05-25 16:51:00.16) How fast can the piezo respond when used in this device? In a previous response to a similar question, soswald replied that the system uses 3 pieces of PC4WM in parallel, that the unloaded piezo response is 115 kHz, and the moving mass is 12 g. This is said to "slightly reduce" the resonant frequency.
Based on the equation on the "Operation" tab of the piezo page, the new resonant frequency is calculates as f' = f0 * sqrt(m/3 / (m/3 + M), where m is the mass of the piezo and M is the mass of the load. The mass of the piezo is not listed, but if I calculate its volume at 0.16 mL, so I'll assume it's mass to be 0.2 g. If I let M=4g, then I find that f' = f0 * 0.13. So, f' = 15 kHz.
A 15 kHz response seems reasonable, but I'm curious if I've done the calculations correctly, and if this agrees with lab measurements of these devices. Additionally, I'd argue that this is more than a "slight" decrease of the frequency response compared to the unloaded piezo. tberg
(posted 2023-05-29 04:45:31.0) Thanks for contacting Thorlabs! I have reached out to you directly to discuss this matter. user
(posted 2023-05-09 18:20:31.063) Hello, I recently used your wonderful SA210-8B products, but accidently disassemble a part of it. When I try to replace the photodetector, not the SM05 thread but the adjacent one was opened. (A round metal plate with holes and an O-ring was hanging on wires connected to the piezo) Closing it up again was not that hard, but I noticed the wires just block the hole for transmitted beam when the cavity was reassembled. I try hard to properly organize that wires, but every attempts were failed. Can you advise how I could reassemble the cavity? Thanks. tberg
(posted 2023-05-09 09:19:53.0) Dear Haejun, Thank You for contacting Thorlabs! The fact that incorrect thread interface accidentally opened upon removal of the detector assembly is clearly a manufacturing error on our part and I apologize for that. I have reached out to you directly on how to solve the problem via RMA. Also, we have taken steps and measures to minimize the risk that this happens again. Andres Forrer
(posted 2023-02-22 10:23:25.697) Could you provide us with the max. optical power allowed to enter the the SA210-12B. There is no information on this part. tberg
(posted 2023-02-23 08:27:47.0) Dear Andres, Thanks for your feedback! Max optical power allowed to enter the the SA210-12B is limited by saturation power of the photodiode used in this product. These are low power devices and typical saturation power is typically about 10mW. There is a large variance in this typical value due to wavelength dependency of the detector responsivity. I will reach out to you directly to discuss your application. Pingping Qiu
(posted 2022-09-13 11:32:36.563) 你好!近期从贵司购买了SA30系列干涉仪,想咨询几个技术问题:1.光源为半导体激光器,中心波长分别为894nm和795nm,针对这两波长,所需透镜能否推荐或定制;2.除了耦合空间光进行测试,是否有合适的接口,可以将经准直后的光束直接和FP干涉仪对接的方法. GUO LONG
(posted 2022-08-04 15:58:05.073) we found that we need to confirm if the low fitness CFBI can meet our system requirement or not. is that possible we apply sample for lab evaluation before purchase. xin yang
(posted 2022-07-05 12:17:08.817) 我想买这个FP的探测器 想咨询一下 jdelia
(posted 2022-07-06 10:08:47.0) Thank you for contacting Thorlabs. We will reach out to you directly regarding your application. Christopher Reilly
(posted 2021-11-11 04:42:22.34) Hello, what is the mechanical frequency response of the piezo actuator on the SA200-30C? soswald
(posted 2021-11-17 02:17:25.0) Dear Christopher,
thank you for your feedback.
Our scanning Fabry Perot Interferometers use 3 pieces of PC4WM piezos in parallel. The resonant frequency of these piezos is 115 kHz ± 10%, specified at no load. The moving mass is about 12 g which slightly reduces the resonant frequency. Please see 'Operation' tab on the piezo webpage for details:
https://www.thorlabs.de/newgrouppage9.cfm?objectgroup_id=61&pn=PC4WM Zeyun Peng
(posted 2021-11-08 15:57:46.273) Hello, we are trying to use SA201 and SA200-8B to measure the frequency drift of our 1092 nm laser. I would like to know how large the coefficient of thermal expansion of the cavity is and how large the long-term drift of the cavity is when it is drove by SA201 with 1x sweep expansion. Right now, I can stabilize the temperature of the cavity within 0.02 K. I observed a frequency drift of 400 MHz within 2 days, and our wavemeter, which is not quite reliable at 100 MHz level, shows that the drift caused by the cavity is within 200 MHz. But I hope to get a better idea of that. YLohia
(posted 2021-11-23 03:30:29.0) Hello, thank you for contacting Thorlabs. The thermal drift of the SA200-8B is typically -0.2 GHz/C. jens lassen
(posted 2021-04-23 19:18:44.853) (i) could you please tell me whether I can exchange optics sets on the SA210-5B to change wavelength coverage? (ii) Would you happen to have a manual / instructions for that? (iii) I would like to operate the SA210-5B in vacuum - would you happen to have a drawing for me that only shows the body? (iv) eventually I would like to reduce the FSR by inserting an invar spacer. Are there provisions for inserting a spacer, as was the case with the old Burleigh CF series or the Tropel CFPI's?
Thank you so much for your help,
Jens YLohia
(posted 2021-04-29 02:22:11.0) Hello Jens, due to the inherent design, mirror sets in the SA210 series are not interchangeable. The SA210 series is not vacuum compatible off-the-shelf. These may or may not be converted to suit low to medium vacuum applications after slight modifications. Support drawings and CAD models showing the body are available on our website. Due to the confocal design, cavity length is fixed so we do not offer spacers to alter the Free Spectral Range. Xu Liang
(posted 2020-11-15 14:29:16.027) Hello, I am encountering such a problem now. I use a broad source (Menlosystems C-Fiber) to reach the free space through a collimator (RC02FC-P01). After passing through the interferometer(SA200-12B), I want to couple the light to another collimator (RC02FC-P01) again, but the actual operation found that the transmittance is extremely low, not reaching 1% at all, and it cannot be coupled to the collimator. What is the reason? Is it the problem of alignment and installation, or the problem of not adding a lens, or that our interferometer can not be used in this way? I hope that there will be special technical support to contact me, thank you very much YLohia
(posted 2020-11-17 09:22:54.0) Thank you for contacting Thorlabs. This is likely due to a few factors -- you must align the system properly (this can take a while) and you also should use a focusing lens before the unit. Please also ensure that the iris in the unit is fully open once the system has properly been aligned. Additionally, the collimators/couplers are designed to focus collimated beams at a fixed distance. The FPI does not output a collimated beam from the detector port so the coupling efficiency into your fiber will also be quite poor, even with good system alignment. user
(posted 2020-10-12 14:43:21.037) 1. If I use this as a filtering cavity can I send light in from either direction? (noting from the cavity geometry suggests otherwise?)
2. What preferred polarization input does it require? YLohia
(posted 2020-10-16 09:22:39.0) Thank you for contacting Thorlabs. 1) You can send light in from either port (after removing the mounted photodiode). 2) There is no specific input polarization state requirement. Vladimir Zenin
(posted 2019-04-15 07:27:50.41) Hi,
I am wondering, can I use Fabry-Perot Interferometer as a spectral filter? I mean, for example as an input I have a nice fiber-coupled beam with spectral width of 10 nm (for example, 1440-1450 nm). With collimator it can be made nearly perfect Gaussian. At the output I need a Gaussian or fiber-coupled light with narrower spectra. I have spectrometer to measure precisely the wavelength, but need a filter. Can Fabry-Perot Interferometer be such a tunable filter? Or are there any better product in Thorlabs?
You might be interested in my source - it is broadband source SuperK Extreme, from NKT Photonics, equipped with SELECT filter (https://www.nktphotonics.com/lasers-fibers/product/superk-extreme-fianium-supercontinuum-lasers/, https://www.nktphotonics.com/lasers-fibers/product/superk-select-multi-line-tunable-filter/). At output I can get as narrow as 5-10 nm spectrum, and its central wavelength is tunable.
Thank you in advance, and happy Easter!
Best,
Vladimir YLohia
(posted 2019-04-17 11:07:22.0) Hi Vladimir, thank you for contacting Thorlabs. In principle, using an FPI as a spectral filter is possible. However, the Free Spectral Range of our high resolution Scanning Fabry-Perot Interferometers is as short as 10 GHz or 1.5 GHz depending on model (SA210 or SA200 series). In the wavelength plane, this corresponds to narrow wavelength bands 75pm or 11.25pm at 1500nm absolute wavelength. And filter bandwidth is as narrow as in the 7-70 MHz range (corresponding to 0.05-0.5pm). This means that the spectrum obtained by the Scanning Fabry-Perot will repeat itself periodically in either 75pm or 11.25pm wavelength bands and filter function is in the 0.05-0.5pm range due to the high resolving power of these instruments. So, filtering from these instruments would only be meaningful if your input signal is narrower than 75pm (or 11.25pm). Commercially available tunable Fabry-Perot filters typically have a Free Spectral Range in the 10 THz range (corresponding to ~100nm) and a bandwidth of a few hundred pm. julian.robertz
(posted 2018-12-11 14:12:51.273) Dear Support-Team
Tank you for the information in the alignment guide.
I have one question regarding the recommended beam size and lens for the FP interferometers you are mentioning in the table. The beam waist behind the lens is highly dependent on the beam waist in front of the lense. Which beam waist have you assumed to give these values? swick
(posted 2019-01-31 09:57:50.0) Thank you for your feedback. For example lenses with focal length 250 mm like LA1461-B or mounted version LA1461-B-ML will provide small enough waist well below recommended 600 µm for 2 mm diameter beam @ 812 nm on input. user
(posted 2018-11-01 15:23:01.95) Can you also provide the high finesse FP cavities (SA30-52) at other wavelengths? YLohia
(posted 2018-11-02 09:17:07.0) Hello, thank you for contacting Thorlabs. We may be able to provide this, depending on your requirements. Please email us at techsupport@thorlabs.com to request a quote for custom items. abc124771
(posted 2018-08-29 22:14:15.52) Can SA201 or SA201-EC be used to drive PC4FL? nbayconich
(posted 2018-09-11 01:17:30.0) Thank you for contacting Thorlabs. The SA201 is designed specifically for driving the piezos of our fabry perot devices. It is not intended to be a general purpose piezo driver. In order to drive the pc4fl actuator to it's full displacement you will need a driver that can supply 150 volts where as the SA201 provide 45 volts max output voltage at 15mA.
I would recommend looking into the BPC301 or MDT694 piezo controllers which can provide a much higher operating voltage and current. jean-michel.melkonian
(posted 2018-07-20 09:03:55.237) HI,
I have exactly the same question as geoffroy.aubry, about the piezo hysteresis. Not only that, but I also observe it on my setup.
We use the FPI to measure the frequency spacing between two modes of our laser source. We calculate the spacing as: Dvu = FSR_FP*(DT_laser/DT_FP), where FSR_FP is the Fabry-Perot FSR (10 GHz nominaly), DT_FP the time spacing between two resonance peaks of the FP (i.e. one FSR in time), and DT_laser the time spacing between the 2 resonance peaks due to the two longitudinal modes of our laser.
The problem is that DT_laser is not the same whether we are looking at the begining of the ramp or at the end, ie there is some dilatation.
Could you contact me to help me calibrate this effect? Thank you. YLohia
(posted 2018-07-23 09:36:52.0) Hello, while the voltage is a linear triangle or sawtooth curve, the cavity length is changed by piezoelectric actuator which will have some hysteresis. This is most exaggerated at the edges of travel, particularly when the direction of travel changes. The response between voltage and position will be most linear in the center of the movement. Due to this PZT hysteresis, the conversion between frequency space and time space varies over the scan of the PZT elements. In order to get the best possible accuracy, we recommend calibrating the time axis in the vicinity of the mode to be measured. In other words, when evaluating the width of a particular transmission peak, calibrate the time axis with the two immediate neighbors of the mode under measurement. abc124771
(posted 2018-05-25 03:13:21.513) Could you please give detailed specifications of the mirrors used for the cavity? Are those mirrors separately available? What are the reflectances and transmissions for the back side and front side of the mirrors? nbayconich
(posted 2018-05-29 09:01:06.0) Thank you for contacting Thorlabs. Yes, we can provide the mirrors of our fabry perot interferometers separately as a custom order item. Any custom or specials orders can be requested through techsupport@thorlabs.com.
The reflectivity of the mirror coating material is above 99% for the coating design range however the typical transmission through the fabry perot interferometer is about 10-20%, the loss is do from absorption in the mirror substrate and coating material after multiple reflections through the cavity. In theory with no absorption loss present the transmission would be significantly higher. I will reach out to you directly with more information about ordering our fabry perot mirrors separately. abc124771
(posted 2018-05-23 04:07:57.34) Can the 7.5mm FP be used to obtain fringes with a white light source? mmcclure
(posted 2018-08-13 10:59:52.0) Yes, it is possible to see fringes without using the drive electronics. You will have to open up the second iris all the way and remove the photodiode connected to the female SMA. The will allow the beam to leave the FPI housing and be projected on to your screen. In order to have good alignment, you will need to first set up your two alignment mirrors before the unit and make adjustments till you see fringes on the output. Once you see the fringes, adjust the z-position of your lens till you obtain optimal fringe contrast. abc124771
(posted 2018-05-14 23:29:51.337) In the 'Calibration' tab, in the example given, linewidth is found to be 4.7MHz, but the resolution for that paticular FPI is just 7.5MHz. If I'm not wrong, resolution is the least we can resolve any spectral line... then how can we measure a line of FWHM 4.7MHz using that particular FPI? YLohia
(posted 2018-05-16 08:39:42.0) We state that the SA 200 resolution is 7.5 MHz corresponding to Finesse = 200. The F=200 is a minimum spec, while the typical spec is F=250 corresponding to resolution = 6 MHz. The relation between finesse and resolution is defined
F = FSR/FWHM,
where F = Finesse, FSR = Free Spectral Range and FWHM = resolution.
Our finesse spec is set quite conservatively, so it's not unusual that we ship units with finesse in the 300-350 range. In the example on the web, a F=320 cavity is used (a random unit tested from stock) corresponding to 4.7 MHz resolution. abc124771
(posted 2018-05-14 02:39:32.15) The 'd' (50mm) is given as 'nominal distance'. So is this 'd' exactly the minimum distance between the two mirrors or the maximum? I mean when we apply voltage, does the distance between the mirrors increase from 50mm or does it decrease to an even lower value than 50mm? Or is it the average? If so, then what is the minimum and maximum 'd' achievable by applying voltage? And also could you please specify the sensitivity of the piezo, as in what is its V/mm rating? YLohia
(posted 2018-05-15 10:00:00.0) Hello, thank you for contacting Thorlabs. The nominal mirror separation d is 50mm with a ±0.1mm tolerance. The piezos used in the SA200 series have a displacement of 9µm for 150V. The SA201 Control box has a max voltage swing of 30V, so the maximum displacement is typically 1.8µm and, in most cases, the full 30V swing is not really necessary. Thus, the distance variation due to applied piezo voltage is typically on the ~1µm scale. unnati_a
(posted 2018-05-07 05:08:31.63) Is it possible to get just fringes with this instrument without scanning and all? I mean if I just want to display the fringe pattern on a screen for some purpose apart from scanning? What alignment precautions will have to be taken in that case, since we won't be using the controller and scope for alignment? YLohia
(posted 2018-05-31 08:59:02.0) Yes, it is possible to see fringes without using the drive electronics. You will have to open up the second iris all the way and remove the photodiode connected to the female SMA. The will allow the beam to leave the FPI housing and be projected on to your screen. In order to have good alignment, you will need to first set up your two alignment mirrors before the unit and make adjustments till you see fringes on the output. Once you see the fringes, adjust the z-position of your lens till you obtain optimal fringe contrast. aspindler
(posted 2018-04-11 12:46:49.307) Hello, I am wondering if your products are suitable for use in a vacuum. My company is interested in developing a space based system using an interferometer. Are your FPIs air spaced? I would assume they might just pop in a vacuum if they don't have a way to outgas. YLohia
(posted 2018-04-12 11:15:11.0) Response from Yashasvi at Thorlabs USA: Hello, thank you for contacting Thorlabs. The stock FPI's you see on our website are not suitable for vacuum use. What is the pressure/vacuum level you intend to use this at? The mirrors used in these are air-spaced, however. We could look into offering just the stripped invar cavity module without the outer housing. We would also have to use vacuum grease and vacuum compatible glue. I have reached out to you directly to discuss this further. user
(posted 2018-03-19 12:48:34.75) Hi guys,
Can i use a sawtooth voltage from an external function generator to drive the piezo of the FPI?
I´m planning a servo-loop feedback to lock a laser to a peak of the FPI, but i need to close the scan. So, can i feed the piezo with a near DC cero voltage from this external generator? nbayconich
(posted 2018-04-05 08:10:44.0) Thank you for contacting Thorlabs. Yes you can use an external function generator to drive the piezo actuators in these fabry perot interferometers. As long as your operating voltage is within our specified range of 0-150V this will be fine. f.loignon.houle
(posted 2018-01-17 06:56:39.62) Hi, If there is a refractive index variation in a material that is probed by a FPI, the phase delay would shift and the transmitted intensity would thus vary. What would be the required sensitivity to measure a varying intensity under very small refractive index modulation? Would your products be able to detect a RI variation of 10^-6 or 10^-5 ? tfrisch
(posted 2018-01-19 09:44:14.0) Hello, thank you for contacting Thorlabs. These FPIs are not for measuring absolute or relative changes in refractive index. They could however measure sidebands if that refractive index change is periodic and if it fast enough that the sideband spacing is greater than the resolution of the FPI and if the depth of modulation (change of index times the path length) is great enough to transfer significant power into the sidebands. I will reach out to you directly to discuss this application. albert.romann
(posted 2017-12-13 16:48:11.27) Can you provide a coating for 260/266nm? (for the 50mm long linear cavity) nbayconich
(posted 2018-01-03 11:32:09.0) Thank you for contacting Thorlabs. We can provide custom coatings for our scanning fabry perots for this wavelength range. I will contact you directly to discuss our custom capabilities. geoffroy.aubry
(posted 2017-10-30 15:50:46.253) Dear Support,
How comes that the distance between first peak and second peak is not the same as between second peak and third peak on figure 3 in the "calibration" tab?
Best,
Geoffroy tfrisch
(posted 2017-11-15 11:57:55.0) Hello, thank you for contacting Thorlabs. The cavity length is controlled by piezo-electric actuators which have some hysteresis. This leads to small non-linearity between voltage and position, particularly at the edges of travel where the direction switches. I will reach out to you directly to discuss this effect. taloh
(posted 2017-10-18 16:17:35.643) I am working on 2um. For SA200-18C and SA210-18C, which fiber collimator is suitable?
Besides, among the two interferometer models (1.5 GHz and 10 GHz), which FSR is more suitable for optimizing the mode hopping of TLK-L1950R? tfrisch
(posted 2018-01-02 10:49:25.0) Hello, thank you for contacting Thorlabs. I am unsure whether you are looking at the 10dB tuning range of the TLK (about 9THz) or the linewidth of a single mode (about 100kHz). In the case of the whole range, the bandwidth would be much larger than the free spectral range of SA200-18C or SA210-18C. In the second case, the linewidth would be smaller than the resolution of SA200-18C or SA210-18C, so you wouldn't be able to look at structure. I will reach out to you to clarify your application, but I'm not sure either of these interferometers would be suitable for your application. For the collimation, a reflective collimator would be convenient for avoiding chromatic focal shift. al
(posted 2017-10-03 19:57:51.537) Hi, Could this product be fit with free-space to SM-fibre-couplers on both the front and back faces of the cavity? Thanks. tfrisch
(posted 2017-10-11 04:37:20.0) Hello, thank you for contacting Thorlabs. While we do not currently offer a fiber pigtailed version, I will post this in our internal engineering forum. I will reach out to you directly to discuss your application. greenjjag
(posted 2017-07-10 11:25:24.217) Could you please tell me the transmittance percentage of 1064nm laser light (or similar) through the back side of the input mirror? For Model SA200-8B. tfrisch
(posted 2017-10-09 03:50:45.0) Hello, thank you for contacting Thorlabs. The peak transmission will be about 10-20%. After many passes through the cavity, the normally negligible absorptivity of the mirror coatings becomes relevant. I will reach out to you directly about calculating this. pevere
(posted 2017-06-25 22:03:00.91) 1) In the tutorial you claim there are no lensing effects due to equal curvature of the inner and outer surfaces of the cavity mirrors while we have measured a diverging lensing effect of the cavity (though not very strong). Can you confirm this?
2) Why is the transmissivity at resonance so low (10-20% instead of a theoretical 50% given the AR coatings) for this device? Is there a way to improve it?
Thanks a lot. tfrisch
(posted 2017-10-09 03:24:36.0) Hello, thank you for contacting Thorlabs. Because light light is typically focused into the cavity, I'd expect it to diverge out the opposite end into the detecting photodiode. I have contacted you directly to discuss the lensing you mentioned. As for the transmission, it will depend primarily on the reflectivity and absorptivity. Though the absorptivity would normally be considered negligible, in a Fabry-Perot cavity, the light may reflect many times off of each surface, and the small components of absorption because relevant. In general, out Fabry-Perot Interferometers would be expected to have a maximum transmission of about 10-20%. I've also contacted you to discuss this. yao_chin
(posted 2017-05-15 21:44:07.703) Do your company sell a pair confocal mirrors of SA200-5B, respectively? nbayconich
(posted 2017-05-18 11:04:04.0) Thank you for contacting Thorlabs. We can provide the mirror components. A Tech Support representative will contact you directly about information for this quote. p.k.molony
(posted 2017-04-21 12:07:05.193) When the voltage to the piezoelectric is increased, does this increase or decrease the length of the cavity? The diagrams suggest an increase, but I would like to know for sure.
I need to know this as I would like to know which direction corresponds to increasing optical frequency, to distinguish +ve and -ve sidebands applied to a laser. jlow
(posted 2017-04-25 04:04:30.0) Response from Jeremy at Thorlabs: The cavity length is increased with increase voltage. michael.clarage
(posted 2017-01-28 10:10:01.86) I suggest considering a "FPI for Dummies" tab.
We are trying to decide if we need a Fabry-Perot interferometer. We are using a good spectrometer, but need more resolution. I knew nothing about FPI before coming to your site.
After several times through your pages, I still am asking myself, "how does all this work, and will it give us the resolution we need." Leo in your Engineering dept has been helping, so thanks to him.
I am a physicist, educator, and writer, so I know the difficulties of conveying complex ideas to someone who does not already know the subject. But I find your web pages are talking to someone who already knows the subject. tcampbell
(posted 2017-02-06 09:06:29.0) Response from Tim at Thorlabs: thank you very much for your feedback. We will look into improving our tutorial on Fabry-Perot interferometry in the near future. Please continue to contact Tech Support with any questions you may have. jabez
(posted 2016-12-16 13:36:02.58) I'm looking for something like the SA-200-3B Fabry-Perot, but I need it to work at 323 nm. Is it possible to get a custom coating? tfrisch
(posted 2016-12-19 03:51:41.0) Hello, thank you for contacting Thorlabs. I will reach out to you directly about the availability of custom coatings. lw493
(posted 2016-11-15 05:37:09.717) Would it be possible to purchase the two concave mirrors (center wavelength 532nm) and what would be their reflectivity?
Also do you have a range of curvatures or is it just 50mm? tfrisch
(posted 2016-11-16 01:43:32.0) Hello. Thank you for contacting Thorlabs. I have reached out to you directly with information on our stock concave mirrors as well as information on how the coatings differ. Whether these will be suitable or whether you need the mirrors from our FPIs will depend on the application. chantianseng
(posted 2016-10-12 18:29:02.007) do the mirrors used in thorlab fpi are wedged mirror? could you pls provide the links for the dielectric coated mirrors that could use in fpi for laser wavelength 660nm? jlow
(posted 2016-10-13 02:53:24.0) Response from Jeremy at Thorlabs: The mirrors used in the FPI are two concave mirrors. We do not have these as stock items on the web but we can provide them separately. I will contact you directly about this. vijay
(posted 2016-04-08 11:17:49.63) Hi, I am looking for a solid etalon. I could only find the Fabry-Perot interferometer on Thorlabs but not a solid etalon. By a solid etalon, I mean a parallel glass with coatings on both sides.
Here is my requirement: I have an optical beam (632nm or 66nm) which I want to split into multiple parallel beams. These are normally created by internal reflection and transmission. I'd really appreciate it if you can help me locate this on ThorLabs catalog - I searched a lot but could not find one.
Many thanks, Vijay. besembeson
(posted 2016-04-13 08:43:00.0) Response from Bweh at Thorlabs USA: Thanks for contacting Thorlabs. We don't offer such solid etalons at this time. We will however look into this based on your feedback. I will contact you with recommendations on where to get these. leemireu
(posted 2016-03-22 05:30:24.083) and whats the transmission of this interferometer itself? besembeson
(posted 2016-03-25 08:57:28.0) Response from Bweh at Thorlabs USA: The transmission at resonance will be in the 10-20% range. This will vary between individual units and different coating runs. Outside resonance, transmission will be in the 10^-4 range through the cavity due to the extremely high mirror reflectivity of >99%. leemireu
(posted 2016-03-22 05:16:26.403) Could you let me know whats the radius of curvature of the mirror? is it same with cavity length? besembeson
(posted 2016-03-25 08:48:13.0) Response from Bweh at Thorlabs USA: Due to the confocal cavity, yes it will be equivalent to the cavity length. sbayliss30
(posted 2016-02-29 12:33:47.397) Hello, could anyone tell me which photodiode is included with the SA200-12B? Thank you jlow
(posted 2016-02-29 11:50:40.0) Response from Jeremy at Thorlabs: The SA200-12B includes the SM05PD4B photodiode. rssi_2nava
(posted 2015-02-24 02:02:25.563) Hey guys,
My question is about the finesse of the SA200-8B FPI. In the .XLS of the reflectance and Finesse you have values above 200, and you say that the values may vary slightly, but i got values beneath 200 in wavelengths between 790-900. The equation for the finesse is F=FSR/FWHM, and i'd measured the distance of adjacent transmission peaks to be the FSR and with mathematica computed the FWHM=gamma with a lorentzian function. Still i got very low values, What am i doing wrong? its laser power dependent? or the alignment its wrong? Hope to hear from you soon, thanks. jlow
(posted 2015-02-25 03:36:25.0) Response from Jeremy at Thorlabs: This is sensitive to your input alignment and beam size. I will contact you directly to troubleshoot about your application. You can also contact us at techsupport@thorlabs.com in the future about similar requests. vittorgd
(posted 2015-02-23 17:36:24.757) Is the internal Invar cavity hermetically sealed? jlow
(posted 2015-02-25 09:08:58.0) Response from Jeremy at Thorlabs: The Invar cavity is not hermetically sealed. philippe.velha
(posted 2015-02-19 04:17:47.433) Hi,
I was wondering if fibers can be adapted, somehow, on both sides of the interferometer to include it in a larger set-up. That would be useful for us to have this possibility.
Thanks in advance. jlow
(posted 2015-02-25 03:21:17.0) Response from Jeremy at Thorlabs: We will contact you directly about customizing this. lmarin
(posted 2014-10-03 12:43:54.96) Which FSR is better for measuring HeNeLaser and laser diodes (around) 650 nm both jlow
(posted 2014-10-03 02:19:31.0) Response from Jeremy at Thorlabs: You would generally want all the modes to be captured within 1 FSR. For regular HeNe, the 10GHz FSR version would be better. Typical Fabry-Perot LD would have modes much wider than 10GHz so this will probably not work well. I will contact you directly to discuss more about this. ilia.sergachev
(posted 2014-08-08 10:48:02.863) Hello, can you offer us a version of this for 4400-4600nm range or sell a version without mirrors/detector? Thank you. jlow
(posted 2014-08-12 08:58:08.0) Response from Jeremy at Thorlabs: We will contact you directly about this special. foggy
(posted 2014-04-22 02:56:00.61) Hello ,I want a Fabry-Perot with 300~600GHz FSR. Do you have this product?? Please contact me as soon as possible. jlow
(posted 2014-04-23 02:20:02.0) Response from Jeremy at Thorlabs: We do not have a version with such a large FSR at the moment. laura.wollny
(posted 2014-04-15 15:19:23.453) Do you also offer custom made versions that are usable in the range of 0.3 to 4 THz? jlow
(posted 2014-04-17 10:34:04.0) Response from Jeremy at Thorlabs: We do not currently have this for THz application. I will contact you directly to provide more details. Rssi_2nava
(posted 2014-03-28 13:04:42.027) Maybe i wasn't clear enough. I'm characterizing the SA200-8B. I want to know with accuracy the wavelength of a laser in order to tune in the correct frecuency for a rubidium transition. So, i was working with the SA200-8B with two lasers,(i know the wavelength of one of them) when i realize that the diference between the consecutive lineshapes or peaks(of one laser) decreased, i mean it's not the same diference of voltage if i measure the 2nd and 3rd or the 1st and the 2nd peak or the 3rd and the 4th. Why is that? Moreover, i was thinking in this relation for obtaining the wavelength: V2-V1=lambda/4, but it seems that if i pick the 3rd and the 4th peak, the relation is not true besembeson
(posted 2014-04-08 08:29:30.0) Response from Bweh E at Thorlabs: The SA200-8B Scanning Fabry Perot Interferometer has a free spectral range FSR of 1.5GHz, i.e the spectrum will repeat itself with 1.5 GHz mode spacing. Remember that 1.5GHz optical frequency shift at 780nm (for example) corresponds to only about 3pm wavelength shift. Given that the wavelengths of the two laser sources are separated by less than 1.5 GHz (or 3 pm at about 780nm) they can be compared and you are able to determine the frequency difference between them very accurately. If the frequency spacing between the two lasers is larger than 1.5GHz, then you are not really able to tell what the total frequency spacing is other than measured value ( distance between peaks) plus or minus an integer number of FSR’s.
So, to be able to tune the unknown laser frequency to the known one, you would first have to know that the frequency separation between the two is less than 1.5GHz to be able to make a useful measurement using the SA200-8B. Rssi_2nava
(posted 2014-03-24 02:26:10.113) I hope you can help me guys, i have two lasers impacting on the FP. I know the wavelength of one of them, but i need a reliable way of obtaining the wavelength of the other one. Can you tell me how can i get that wavelength? I know the FSR of my FP(SA200-8B), and the linewidth of the lineshape in frequency, but i can't come up with a way of obtaining lambda. david.n.hutch
(posted 2013-12-31 15:16:48.507) What voltage output does the SA201 apply to the SA200? (For full-scale triangle wave sweep.) jlow
(posted 2014-01-02 04:44:29.0) Response from Jeremy at Thorlabs: The output voltage range is 1-45V. The scan voltage is adjustable from 1-30V and you can put in an offset voltage of 0-15V. nnichen
(posted 2013-11-16 18:02:48.04) Can this FP cavity reconstruct for those: 1. replace the mirror with our own mirror. 2. insert one piece of glass in between the cavity. 3. control with our exist function generator. jlow
(posted 2013-11-18 04:59:09.0) Response from Jeremy at Thorlabs: The components of the cavity are epoxied in place and we do not recommend replacing this yourself. We will get in touch with you directly to discuss about your application. zimmicha
(posted 2013-10-10 23:38:38.39) I have n SAPlus Burleigh confocal spectrum analyzer for the 1500nm spectral range. Can you provide replacement mirrors for the 808nm region? jlow
(posted 2013-10-14 11:34:00.0) Response from Jeremy at Thorlabs: We will contact you directly regarding the mirrors. gerhard.pfeifer
(posted 2013-10-10 09:22:07.707) Can you specify what you mean with "Ultra-Stable Athermal Invar Cavity"?
How large ist the drift in Mhz/K? rscholl
(posted 2013-10-10 16:28:00.0) Using an external heater with SA200-14A, we measured a temperature coefficient of frequency of approximately -0.097 GHz/K around 297K. Using an external heater with SA210-14A, we measured a temperature coefficient of frequency of approximately +1.56 GHz/K around 297K. The measurement was made using an older model, but the drift values should be comparable as the mirror dimensions and substrate are identical. The values should also be comparable within the respective SA200 and SA210 families with different mirror coatings. I will contact you directly. darmstr
(posted 2013-08-23 12:39:08.213) I have a SA210-8B that has damaged coatings. I calculate the peak on-axis irradiance inside the cavity, with enhancement from finesse, to be about 17W/cm^2 CW at 1053 nm. That is the highest power this etalon has ever been exposed to. Whatever the damage threshold is for these coatings, it's pretty low.
I purchased a replacement SA210-8B and will greatly reduce the input power, however it will probably be insufficient for my application. So here's my question: If I return the etalon with the damaged coatings, can I have replacement mirrors installed that have higher damage threshold V-coatings at 1053 nm, or with V-coatings centered at 1064 nm, if that is more convenient? If yes, can you provide a quote for cost and lead time? Thanks, Darrell Armstrong. tcohen
(posted 2013-08-29 16:09:00.0) Response from Tim at Thorlabs to Darrell: Thank you for your feedback. We will contact you to go over your beam parameters and to discuss a quote. user
(posted 2013-08-09 12:03:35.637) Does the controller provide FP with a DC output instead of sawtooth/triangle? jlow
(posted 2013-08-09 08:11:00.0) Response from Jeremy at Thorlabs: The SA201 only provide sawtooth or triangle waveform and no pure DC output. There's however an adjustable DC offset feature. jlow
(posted 2012-12-27 11:43:00.0) Response from Jeremy at Thorlabs: We are currently revising the FP interferometer tutorial online and we will make it available on the website shortly. I will get in contact with you directly regarding some references to the working principle of this device. aadhi.prl.res.in
(posted 2012-12-27 05:50:19.493) We purchased two Scanning Fabry-Perot interferometer and we are using in our laboratory. We want to know the working principles of this instrument but it is not available from the thorlab website. So can you send some papers or tutorial about the SFB interferometer. rscholl
(posted 2012-12-10 11:25:00.0) Response from Ryan at Thorlabs: Thank you for contacting us. A confocal cavity, such as is used here, works best with a TEM00 (Gaussian, spatially coherent) beam, as light is continually focused at the center by the cavity mirrors. My feeling is that it wouldn’t be suitable for your application if the emitter is larger than a couple tens of microns because rays will traverse different paths (and path lengths) through the cavity. This would result in multiple lines apparent on the scope or lower resolution.
We are not aware of an appropriate solution for collimating light that does not emanate from a point source. Using a small pinhole and aspheric lens may be effective to some extent, but the power will be quite limited.
The minimum power required depends on the quality of the beam, spectral distribution, wavelength, amplification of the detector and the skill of the user. Using the included detector and recommended setup at 800nm, ~50uW may be used as a guideline for the lower bound of a practical value of TEM00 light that can be detected. However, it cannot be said for certain in the case of this application. shoryerland
(posted 2012-11-14 03:08:21.84) Can SA210-5B be used to detecte the radiation from an ordinary rubidium hollow-cathode lamp?And how can I collimate the light into the interferometer?What is the minmum allowed input power for the SA210-5B ? sharrell
(posted 2012-10-09 10:33:00.0) Response from Sean at Thorlabs: Thank you for your feedback. We have been investigating the text issues on this page. There appears to be several formatting issues on the tutorial tab which are causing some text to display unusually in several browsers, and we will fix that problem today. We will also revisit the text on this page within the next several weeks to improve it. I am contacting you directly to see if you have any specific recommendations. cdurfee
(posted 2012-09-27 06:01:14.0) You should proofread the overview section of the fabry-perot description. There are some missing words that make it hard to read. jlow
(posted 2012-08-27 17:04:00.0) Response from Jeremy at Thorlabs: The photodiode used in the SA200-18B is the FGA20. You can see the specs you are looking for in the spec sheet found at http://www.thorlabs.com/Thorcat/12100/FGA20-SpecSheet.PDF. linqian
(posted 2012-08-24 23:42:13.0) Do you have the specification for the photodiode that comes with SA200-8B? More specifically, I want to know the photo sensitivity, effective area, dark current, cutoff frequency and capacitance. Thanks. bdada
(posted 2012-04-23 18:39:00.0) Response from Buki at Thorlabs to littlefox121:
Thank you for participating in our feedback forum. The scanning Fabry Perot is designed for CW light sources. I have contacted you to provide further assistance. littlefox121
(posted 2012-04-20 09:41:21.0) I'm wondering the product scanning Fabry Perot suits for pulsed-laser source measurement?
(repetition rate:10Hz duration:~10ns) jjurado
(posted 2011-07-05 14:22:00.0) Response from Javier at Thorlabs to ghiyas1111: Thank you very much for contacting us. All of the documentation concerning the operation and setup instructions for our scanning Fabry-Perot interferometers is available on this page. I would suggest starting with the online tutorial so that you can familiarize with the theoretical background of these devices. You can find it in the Overview tab and here: http://www.thorlabs.com/tutorials.cfm?tabid=21118. Now, for optomechanical alignment instructions of the interferometer, you can refer to the manual. This document is available on the Documents and Drawings tab and also here: http://www.thorlabs.com/Thorcat/19500/19501-D02.pdf. I will also contact you directly for further support. ghiyas1111
(posted 2011-07-02 15:10:28.0) i am from pakistan i had purchased it please tell me how to use it or if u have any video please send me or tell me ur phone number i will call u Thorlabs
(posted 2010-08-16 16:05:08.0) Response from Javier at Thorlabs to Lars Sandström: we do not have test data for the damage threshold of these Fabry-Perot interferemometers. However, the limiting factor is the power handling capability of the detector. As a guideline, it is recommended to limit the input to below 100 mW/cm^2. lsandstrom
(posted 2010-08-16 12:40:47.0) What is the maximum allowed input power for the SA210-5B to avoid dammage to the device? Adam
(posted 2010-04-28 10:00:10.0) A response from Adam at Thorlabs to jdonnelly: We recommend using as much force as possible. It is possible for these to get stuck and become impossible to remove. If that is the case, we can take it back for repair. jdonnelly
(posted 2010-04-27 20:49:21.0) It is not clear to me how to remove the detector unit, as specified in your alignment directions. The threaded piece at the back looks like it should turn but it doesnt, at least by hand. We are reluctant to use more force unless you so recommend. Tyler
(posted 2009-11-30 18:10:59.0) A response from Tyler at Thorlabs: In addition to a plot of the mirrors reflectance, an Excel file has been added to the Graphs tab that contains the data used to make the plot. Tyler
(posted 2009-11-20 08:54:33.0) A response from Tyler at Thorlabs: Thank you for suggesting the need to have the mirror performance data on this webpage. I added the Graphs tab to the presentation with this data on it. Please let us know if you need any additional information. klee
(posted 2009-11-19 10:55:27.0) A response from Ken at Thorlabs: We can send you the coating curves if you can provide your email address. user
(posted 2009-11-18 20:54:27.0) would be useful to have the coating curves Greg
(posted 2009-03-12 10:09:53.0) A response from Greg at Thorlabs to dergachev: Thank you for your interest in our SA200 series of Fabry-Perot Interferometers. We should be able to make a custom SA200 that fits your needs. A member of our Technical Support team has e-mailed you to discuss this possibility. dergachev
(posted 2009-03-11 14:13:08.0) Do you have a SA-200 version suitable for operation at 2 um?
Please advise.
Thanks.
Alex Dergachev Tyler
(posted 2009-02-12 09:45:01.0) A response from Tyler to melsscal:For the SA200-14A, which has a wavelength range from 1450 nm to 1625 nm, the following parts are required to replicate the setup shown in the Alignment Guide tab. PH4E (Qty. 2), TR4 (Qty. 2), ER6 (Qty. 8), ER4 (Qty. 8), LCP02 (Qty. 1), CP02 (Qty. 1), SM1V10 (Qty. 1), AC254-250-C (Qty. 1), SM1L03 (Qty. 1), KCB1 (Qty. 1), BB1-E04 (Qty. 1), CP02FP (Qty. 1), and PAF-X-18-PC-C (Qty. 1). The optional alignment guides, which I strongly recommend, are the LCPA1 and CPA1 (1 Each). There are definitely other ways to do this so I recommend talking to a member of our tech support department. I will email you this list, which can then be turned into a quote if you desire. Thank you for using this feedback forum to post your question, as I think that this information may be useful to other customers. melsscal
(posted 2009-02-12 05:52:05.0) Can you please confirm the parts list for the fiber coupled setup with SA200-14A. jwk
(posted 2008-06-17 11:10:31.0) Hello, I used your FP interferometer well. Could you tell me whether you can supply the FP for 1800-2100 nm? I look forward to your reply.
Best regards,
Ji Won Tyler
(posted 2008-03-19 08:40:39.0) Response from Tyler at Thorlabs to melsscal: Thank you for your interest in our product. The output connector on the photodiode in the Fabry-Perot Interferometer is SMA. Included with the interferometer is a cable with an SMA connector on one end and a BNC connector on the other end. This information will soon be part of our product presentation. Thank you once again for taking the time to help us make our product presentation better. melsscal
(posted 2008-03-19 06:24:39.0) How we will get the output of this etalon? kbuffington
(posted 2007-10-18 11:45:57.0) Consider adding the following:
If launching a free space beam into the interferometer, the beam size should be approximately 4mm. For optimum performance, the beam should then be focused to a waist with less than 600um diameter using a lens with approximately 250mm focal length. The center of the Fabry-Perot cavity should be located near the beam waist. To achieve this, use an FC/PC collimator (Thorlabs item# F260FC-*, page 1010 Thorlabs catalog, Vol 19) to collimate the beam from your fiber coupled laser. Then a lens with 250mm focal length should be inserted into the collimated beam to produce the desired spot size. We recommend the Thorlabs item# LB1056-C found on page 708 in the Thorlabs catalog, Vol 19. |

 Zoom
Zoom
Click to Enlarge
SA30 Series Interferometer Mirror Reflectance
- Near-Confocal Fabry-Perot Design with Sub-MHz Resolution
- High Finesse: ≥1500
- 10% to 20% On-Resonance Transmission (Typical)
- Ultrastable Athermal Invar Cavity
- Low Scan Voltage (2.5 V per FSR @ 633 nm)
- Ø2" Flange for Mounting in Thorlabs' KS2 or KC2L(/M) Mounts
- SMA-to-BNC Cable Included
The SA30 series Fabry-Perot Interferometers have a free spectral range of 1.5 GHz. With a minimum finesse of 1500, the resolution of these interferometers is <1 MHz. Six wavelength ranges are available, which are listed in the table below and illustrated in the graph to the right. See the Graphs tab for more information.
Custom mirror coatings for wavelengths from the UV to the mid-IR (200 nm to 4700 nm) are available upon request. If these coatings do not suit the needs of your application, please contact Tech Support.
| Item # | Wavelength Range | Free Spectral Rangea | Total Finesse | Resolution | Cavity Lengthb | Mirror Substrate | Detector |
|---|---|---|---|---|---|---|---|
| SA30-47 | 400 - 535 nm | 1.5 GHz | ≥1500 | <1 MHz | 50 mm | UV Fused Silica | Yes |
| SA30-57 | 490 - 640 nm | ||||||
| SA30-73 | 630 - 824 nm | ||||||
| SA30-95 | 824 - 1071 nm | ||||||
| SA30-120 | 1060 - 1350 nm | ||||||
| SA30-144 | 1250 - 1625 nm | IR-Grade Fused Silica (Infrasil®) |

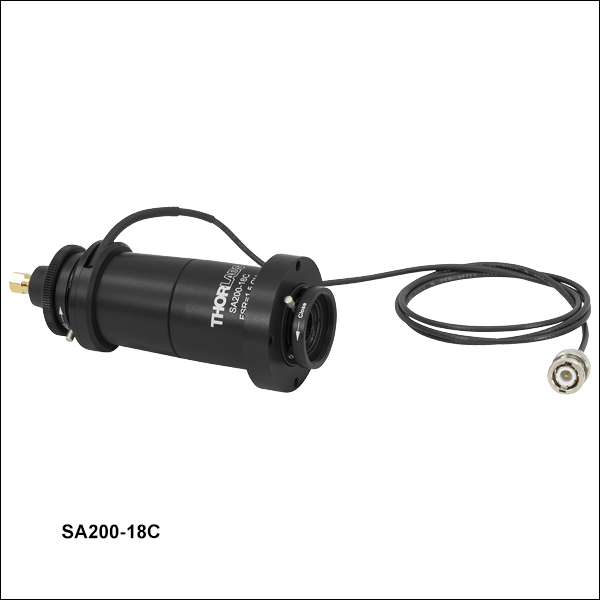 Zoom
Zoom
Click to Enlarge
SA200 Series Interferometer Mirror Reflectance
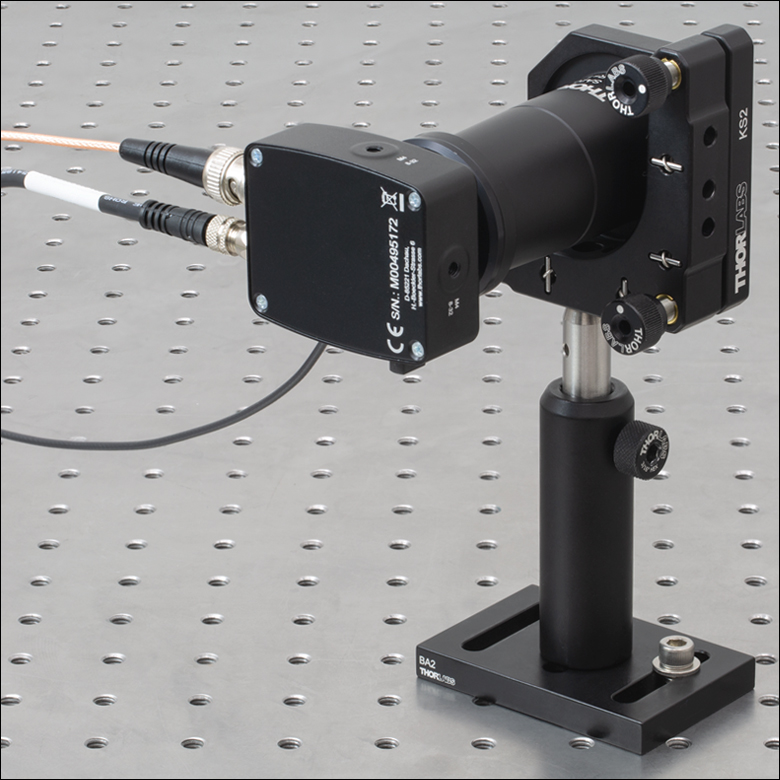
Click to Enlarge
SA200-30C with PDAVJ5 Detector Installed
- Confocal Fabry-Perot Design
- Wavelength Ranges from UV to MIR
- Ultrastable Athermal Invar Cavity
- Low Scan Voltage (2.5 V per FSR @ 633 nm)
- Ø2" Flange for Mounting in Thorlabs' KS2 or KC2L(/M) Mounts
- SMA-to-BNC Cable Included (Except for SA200-30C)
The SA200 series of Fabry-Perot interferometers have a free spectral range of 1.5 GHz. With a minimum finesse of 200, the resolution of these interferometers is 7.5 MHz. Seven optical coatings are available with operating ranges from 290 to 4400 nm, including one dual-wavelength coating (SA200-2B). These are listed in the table below and illustrated in the graph to the right. See the Graphs tab for more information. Custom mirror coatings for wavelengths from the UV to the mid-IR (200 nm to 4700 nm) are available upon request. If these coatings do not suit the needs of your application, please contact Tech Support.
For the SA200-18C, the included photodiode detector is sensitive to wavelengths from
The SA200-30C has a coating designed for 3.0 - 4.4 µm and does not include a detector. We recommend using the PDAVJ5 HgCdTe Amplified Photodetector, which is sensitive to wavelengths in the 2.7 - 5.0 µm range. The PDAVJ5 and the SA200-30C, which have external and internal SM1-threading respectively, can be directly mounted together without using additional threaded adapters. Please note that the PDAVJ5 includes a transimpedance amplifier, so the detector should not be connected to the transimpedance amplifier of the SA201B controller when operating the interferometer. Additionally, due to saturation effects of the diode inside the PDAVJ5 detector, the optical power entering the SA200-30C should be kept below 200 µW in order to avoid saturation.
| Item # | Wavelength Range | Free Spectral Range | Total Finesse | Resolution | Cavity Lengtha | Mirror Substrate | Detector |
|---|---|---|---|---|---|---|---|
| SA200-2B | 290 - 355 nm; 520 - 545 nm | 1.5 GHz | >200 (250 Typ.) |
7.5 MHz | 50 mm | UV Fused Silica | Yes |
| SA200-3B | 350 - 535 nm | ||||||
| SA200-5B | 535 - 820 nm | ||||||
| SA200-8B | 820 - 1275 nm | ||||||
| SA200-12B | 1275 - 2000 nm | ||||||
| SA200-18C | 1800 - 2600 nm | IR-Grade Fused Silica (Infrasil®) | |||||
| SA200-30C | 3000 - 4400 nm | Yttrium Aluminum Garnet (YAG) | No |

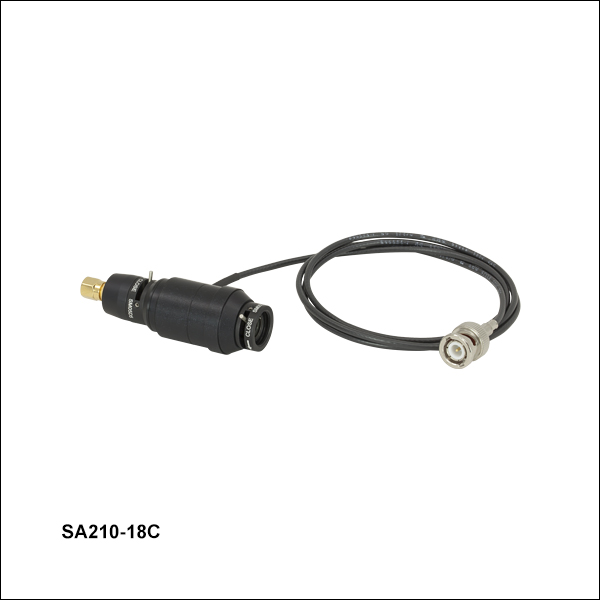 Zoom
Zoom
Click to Enlarge
SA210 Series Interferometer Mirror Reflectance
- Confocal Fabry-Perot Design
- Ultrastable Athermal Invar Cavity
- Low Scan Voltage (2.5 V per FSR @ 633 nm)
- Ø1" Flange for Mounting in Thorlabs' KS1 or KC1L(/M) Mounts
- SMA-to-BNC-Cable Included
The SA210 series of Fabry-Perot interferometers have a free spectral range of 10 GHz. With a minimum finesse of 150, the resolution of these interferometers is 67 MHz. Five wavelength ranges are available which are listed in the table below and illustrated in the graph to the right. See the Graphs tab for more information. Custom mirror coatings for wavelengths from the UV to the mid-IR (200 nm to 4700 nm) are available upon request. If these coatings do not suit the needs of your application, please contact Tech Support.
For the SA210-18C, the included photodiode detector is sensitive to wavelengths from 1.8 - 2.6 µm. Since the reflectance of the mirrors inside this device remains over 99.0% in the 2.6 - 2.8 µm range, an alternative detector can be installed to use the instrument over an extended wavelength range. For this purpose, we recommend Thorlabs' PDA10PT (PDA10PT-EC) detector, which can be attached to the Fabry-Perot interferometer using an SM1T2 lens tube coupler.
| Item # | Wavelength Range | Free Spectral Range | Total Finesse | Resolution | Cavity Lengtha | Mirror Substrate | Detector |
|---|---|---|---|---|---|---|---|
| SA210-3B | 350 - 535 nm | 10 GHz | >150 (180 Typ.) |
67 MHz | 7.5 mm | UV Fused Silica | Yes |
| SA210-5B | 535 - 820 nm | ||||||
| SA210-8B | 820 - 1275 nm | ||||||
| SA210-12B | 1275 - 2000 nm | ||||||
| SA210-18C | 1800 - 2600 nm | IR-Grade Fused Silica (Infrasil®) |

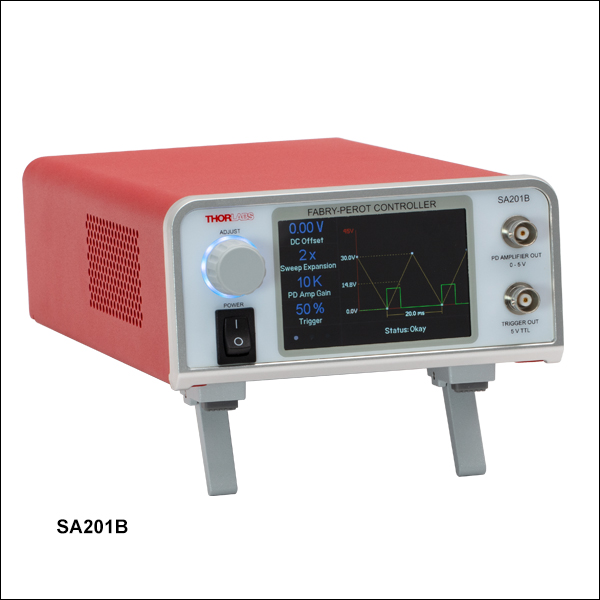 Zoom
Zoom| Ramp Specifications | |
|---|---|
| Waveform | Sawtooth or Triangle |
| Output Voltage Range | 1 - 45 V (Offset + Amplitude) |
| Monitor Output Attenuation | 10:1 (Output:Monitor) |
| Offset Adjustment Range | 0 - 15 VDC |
| Amplitude Adjustment Range | 1 - 30 V (Peak to Peak) |
| Rise Time Adjustment Range | 1X Sweep Expansion: 0.01 - 0.1 s 100X Sweep Expansion: 1 - 10 s |
| Sweep Expansion | 1X, 2X, 5X, 10X, 20X, 50X, 100X |
| Sweep Scale Error | ±0.5% |
| Output Noise | 1 mV (RMS) ~6.6 mV (Peak to Peak) |
| Trigger Voltage | 5 V TTL |
| Trigger Rise Edge | Ramp Start |
| Trigger Fall Edge | 1% to 99% User Adjustable |
| Photoamplifier Specifications | |
|---|---|
| Gain Steps (Hi-Z) | 10, 100, or 1000 kV/A |
| Output Voltage (Hi-Z) | 0 - 5 V |
| Bandwidth | 250 kHz |
| Noise (RMS) | <0.1 mV @ 10 kV/A 0.2 mV @ 100 kV/A 1.5 mV @ 1000 kV/A |
- TTL Trigger Output
- Trigger Rising Edge at Ramp Start
- Trigger Falling Edge is User Adjustable Along the Ramp
- Adjustable DC Offset of Scan Voltage for Waveform Positioning
- Adjustable Scan Time: 0.01 to 10 s
- Triangle or Sawtooth Scan Voltage
- Transimpedance Gain Amplifier for Photodiode Output
- LCD Touchscreen Display for Device Control
The SA201B is specifically designed to control Thorlabs' Fabry-Perot interferometers by generating a highly stable, low-noise voltage ramp. This ramp signal is used to scan the separation between the two cavity mirrors.
The controller front panel features an LCD touchscreen interface and two female BNC ports for connecting a Fabry-Perot interferometer and an oscilloscope. The LCD interface can be used to adjust the ramp voltage and scan time, allowing the user to choose the scan range and speed, as well as the voltage offset, which allows the spectrum displayed on an oscilloscope to be shifted right or left. The rear panel of the controller features three additional female BNC ports for connections to the same interferometer and oscilloscope; for more information, see the Connections tab.
The SA201B controller also includes a high precision photodetector (PD) amplifier circuit used to monitor the transmission of the cavity. The amplifier provides an adjustable transimpedance gain of 10 kV/A, 100 kV/A, or 1000 kV/A when driving a high impedance load, such as an oscilloscope. Using the PD amplifier output signal from the controller, an oscilloscope can be used to display the spectrum of the input laser. The detector circuitry incorporates a blanking circuit, which can disable the photodiode response during the falling edge of the sawtooth waveform.
A trigger output allows the user to externally trigger an oscilloscope on either the beginning of the ramp waveform or at a user-adjustable location along the ramp waveform, including the midpoint. The ability to trigger the oscilloscope from a variable location along the ramp makes zooming in on a line shape more convenient; just place the spectral component of interest on the center of the screen and increase the timebase of the scope. There is no need to use the offset to re-center the signal; the scope expands about the point of interest. A calibrated zoom capability provides a 1X, 2X, 5X, 10X, 20X, 50X, or 100X increase in the length of the ramp signal, thus allowing an extremely wide range of scan times.
The controller can also be operated remotely from a computer, using Thorlabs' Scanning Fabry-Perot Control Software. A Software Development Kit (SDK) is also available, allowing the controller to be integrated into other systems. See the SA201B Software tab for minimum requirements and download.
The SA201B controller is shipped with a 120 VAC power supply line cord for use in the US or a 230 VAC power supply line cord for use in Europe.