 Products Home / Optogenetics / Optogenetics Patch Cables / Optogenetics Patch Cables, Ø400 µm Core, 0.39 NA Fiber
Optogenetics Patch Cables, Ø400 µm Core, 0.39 NA Fiber
- Ø400 µm Core, 0.39 NA Multimode Fiber
- Ferrule End Quickly Connects to Cannula
- Available with SMA905 or FC/PC Connector on Other End
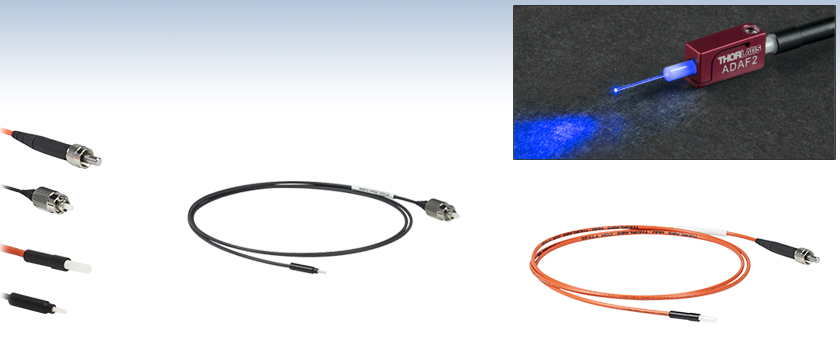
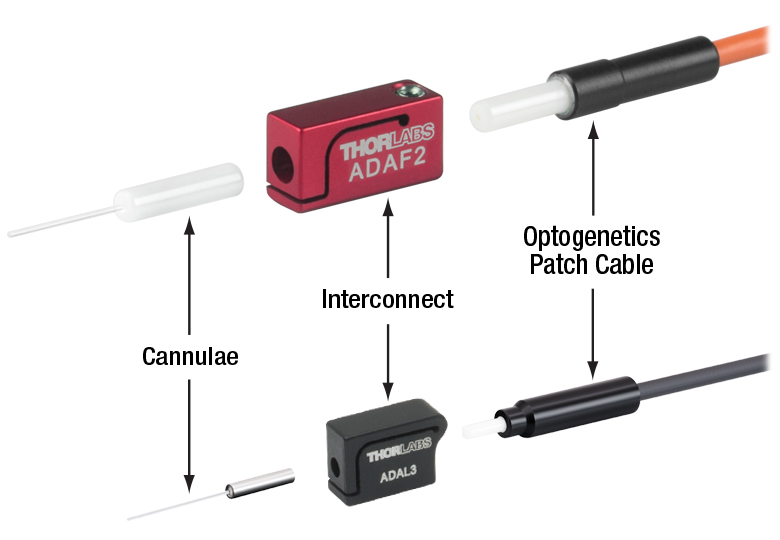
Ø400 µm Patch Cable and Cannula with ADAF2 Interconnect
M99L01
Cable with SMA905 Connector and LC Ferrule
M79L01
Cable with FC/PC Connector and FC Ferrule
Patch Cable Ends
SMA905 Connector
FC/PC Connector
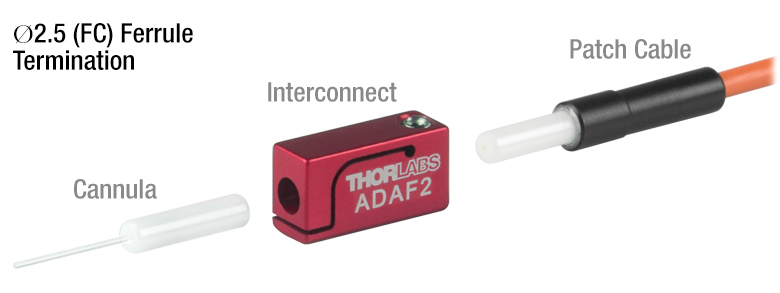
Ø2.5 mm (FC) Ferrule
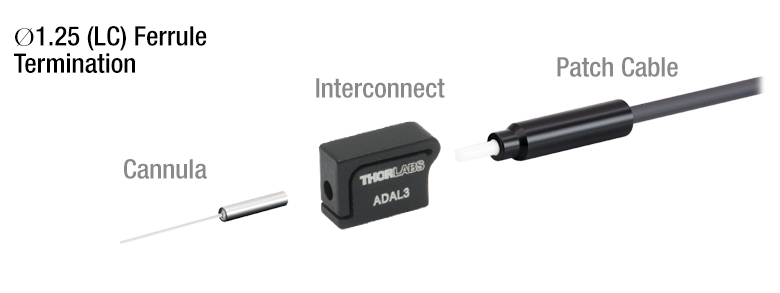
Ø1.25 mm (LC) Ferrule


Please Wait
| Patch Cable Fiber Specifications | |
|---|---|
| Fiber Type | FT400EMT |
| Wavelength Range (Click for Plot) |
400 - 2200 nm |
| Core Diameter | 400 ± 8 µm |
| Cladding Diameter | 425 ± 10 μm |
| Coating Diameter | 730 ± 30 μm |
| Numerical Aperture | 0.39 |
| Max Core Offset | 7 µm |
| Minimum Bend Radius (Short Term / Long Term) |
43 mm / 86 mm |
Click for Details
All Fiber Optic Cannulae and Optogenetics Patch Cables can be easily mated using an Interconnect or Mating Sleeve.
Features
- Optogenetics Patch Cables with Ø400 µm Core, 0.39 NA Fiber
- Available with Ø1.25 mm (LC) or Ø2.5 mm (FC) Ferrule on One End
- FC/PC or SMA905 Connector on the Non-Specimen Side
- Heat-Shrink Tubing Provides Minimal Weight
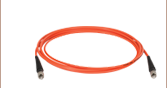
These optogenetics patch cables are designed with a ferrule on one end to connect an LED or laser light source to a fiber optic cannulae during an optogenetic experiment (see diagram below for an example setup). Interconnects or mating sleeves are used to connect the ferrule of the patch cable to the cannula (as seen in the image to the right). The patch cables sold on this page have a single input and output; other common configurations include bifurcated Y-cables, dual-core cables, and rotary joint patch cables.
The fiber patch cables sold on this page use a Ø400 µm, 0.39 NA fiber
(Item # FT400EMT) with a variety of ferrule, connector, and length options. They are available with either a Ø1.25 mm or Ø2.5 mm ceramic ferrule end. The smaller footprint of the Ø1.25 mm ferrule cables offers the ability to implant several cannulae closer together for applications such as bilateral stimulation. In contrast, Ø2.5 mm ferrules provide a more robust connection and cables are easier to handle and ideal for larger specimens.
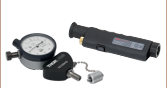
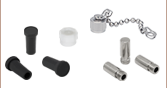
Each patch cable includes two protective caps that shield the ferrule ends from dust and other hazards when not in use. Additional plastic, metal, or threaded caps for the connector and ferrule ends are sold separately here. If the fiber ends become dirty from use, we offer a selection of inspection tools, as well as fiber optic cleaning products.
Click to Enlarge
Multiple fiber NAs are available across our optogenetics product line; cannulae with a 0.39 NA are sold on this page.
Mating Sleeve and Patch Cable Compatibility
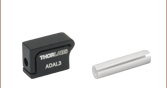
The ferrule diameter of a patch cable and cannula is the key factor for physical compatibility with an interconnect and mating sleeve. Mixing stainless steel and ceramic ferrules should not introduce significant additional signal losses. Cannulae and patch cables using Ø1.25 mm (LC) ferrules can be connected using the ADAL1mating sleeve or ADAL3 interconnect. Patch cables and cannulae using Ø2.5 mm (FC) ferrules are compatible with the ADAF1 mating sleeve and ADAF2 interconnect.
Numerical Aperture (NA)
For best performance, choose a patch cable and cannula with the same fiber core diameter and NA. Numerical Aperture (NA) defines the angle of the cone of light leaving the fiber tip at the end of the cannula and is a dimensionless quantity used by fiber manufacturers to specify the acceptance angle of an optical fiber. Cannulae with a lower NA provide a narrower cone of light at the tip, resulting in higher light intensity over a smaller area, while cannulae with a higher NA generate a wider cone of light that illuminates a larger area with lower intensity.
Custom Cables
Thorlabs also manufactures custom fiber optic cables with same-day shipping. We offer our ferrule cables with many other fiber types, in any length, and many other custom features.
Optogenetics Product Family for In Vivo Applications
Thorlabs offers a wide variety of products designed to support in vivo optogenetics applications (see the table below for related items). Please visit the OG Selection Guide tab above to see a full listing of available products for different applications.
| Related Optogenetics Products | ||||
|---|---|---|---|---|
| Light Sources | Patch Cables (Ø400 µm Core) | Mating | Cannulae (Ø400 µm Core) | Accessories |
| Fiber-Coupled LEDs MM Laser, 473 nm |
Standard Rotary Joint |
Interconnects Mating Sleeves |
Standard | Implant Guides Cannula Holders |
Click to Enlarge
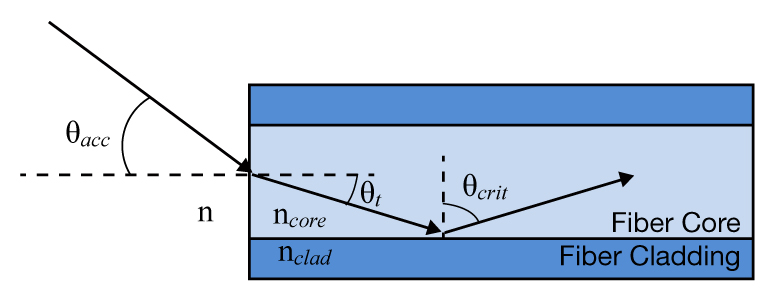
Total Internal Reflection in an Optical Fiber
Guiding Light in an Optical Fiber
Optical fibers are part of a broader class of optical components known as waveguides that utilize total internal reflection (TIR) in order to confine and guide light within a solid or liquid structure. Optical fibers, in particular, are used in numerous applications; common examples include telecommunications, spectroscopy, illumination, and sensors.
One of the more common glass (silica) optical fibers uses a structure known as a step-index fiber, which is shown in the image to the right. Step-index fibers have an inner core made from a material with a refractive index that is higher than the surrounding cladding layer. Within the fiber, a critical angle of incidence exists such that light will reflect off the core/cladding interface rather than refract into the surrounding medium. To fulfill the conditions for TIR in the fiber, the angle of incidence of light launched into the fiber must be less than a certain angle, which is defined as the acceptance angle, θacc. Snell's law can be used to calculate this angle:
![]()
where ncore is the refractive index of the fiber core, nclad is the refractive index of the fiber cladding, n is the refractive index of the outside medium, θcrit is the critical angle, and θacc is the acceptance half-angle of the fiber. The numerical aperture (NA) is a dimensionless quantity used by fiber manufacturers to specify the acceptance angle of an optical fiber and is defined as:
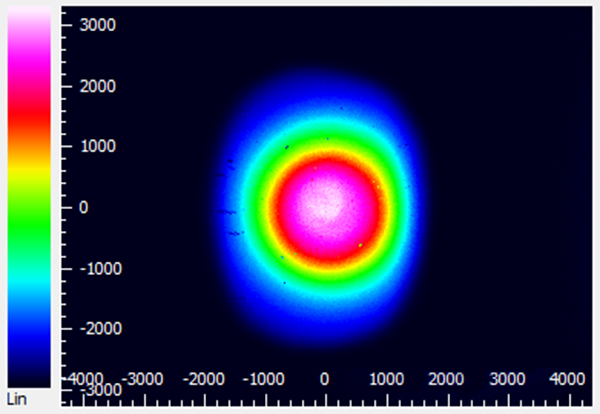
In step-index fibers with a large core (multimode), the NA can be calculated directly using this equation. The NA can also be determined experimentally by tracing the far-field beam profile and measuring the angle between the center of the beam and the point at which the beam intensity is 5% of the maximum; however, calculating the NA directly provides the most accurate value.
Number of Modes in an Optical Fiber
Each potential path that light propagates through in an optical fiber is known as a guided mode of the fiber. Depending on the physical dimensions of the core/cladding regions, refractive index, and wavelength, anything from one to thousands of modes can be supported within a single optical fiber. The two most commonly manufactured variants are single mode fiber (which supports a single guided mode) and multimode fiber (which supports a large number of guided modes). In a multimode fiber, lower-order modes tend to confine light spatially in the core of the fiber; higher-order modes, on the other hand, tend to confine light spatially near the core/cladding interface.
Using a few simple calculations, it is possible to estimate the number of modes (single mode or multimode) supported by an optical fiber. The normalized optical frequency, also known as the V-number, is a dimensionless quantity that is proportional to the free space optical frequency but is normalized to guiding properties of an optical fiber. The V-number is defined as:
![]()
where V is the normalized frequency (V-number), a is the fiber core radius, and λ is the free space wavelength. Multimode fibers have very large V-numbers; for example, a Ø50 µm core, 0.39 NA multimode fiber at a wavelength of 1.5 µm has a V-number of 40.8.
For multimode fiber, which has a large V-number, the number of modes supported is approximated using the following relationship.
![]()
In the example above of the Ø50 µm core, 0.39 NA multimode fiber, it supports approximately 832 different guided modes that can all travel simultaneously through the fiber.
Single mode fibers are defined with a V-number cut-off of V < 2.405, which represents the point at which light is coupled only into the fiber's fundamental mode. To meet this condition, a single mode fiber has a much smaller core size and NA compared to a multimode fiber at the same wavelength. One example of this, SMF-28 Ultra single mode fiber, has a nominal NA of 0.14 and an Ø8.2 µm core at 1550 nm, which results in a V-number of 2.404.
Click to Enlarge
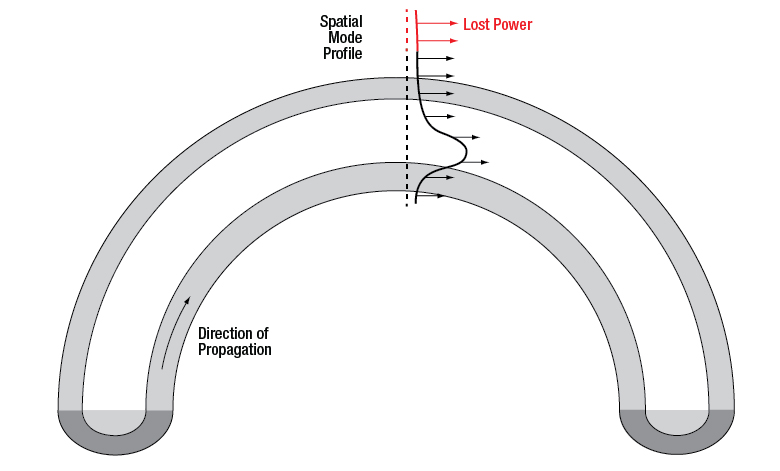
Attenuation Due to Macrobend Loss
Click to Enlarge
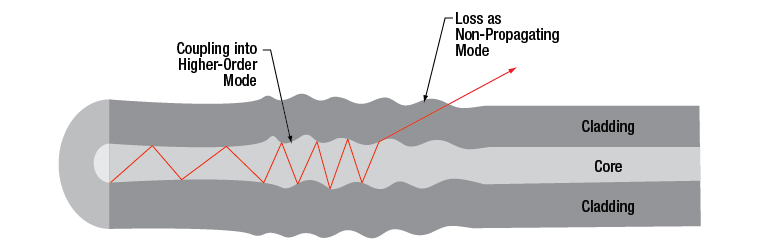
Attenuation Due to Microbend Loss
Click to Enlarge
Beam profile measurement of FT200EMT multimode fiber and a former generation M565F1 LED (replaced by the M565F3) showing light guided in the cladding rather than the core of the fiber.
Sources of Attenuation
Loss within an optical fiber, also referred to as attenuation, is characterized and quantified in order to predict the total transmitted power lost within a fiber optic setup. The sources of these losses are typically wavelength dependent and range from the material used in the fiber itself to bending of the fiber. Common sources of attenuation are detailed below:
Absorption
Because light in a standard optical fiber is guided via a solid material, there are losses due to absorption as light propagates through the fiber. Standard fibers are manufactured using fused silica and are optimized for transmission from 1300 nm to 1550 nm. At longer wavelengths (>2000 nm), multi-phonon interactions in fused silica cause significant absorption. Fluoride glasses such as ZrF4 and InF3 are used in manufacturing Mid-IR optical fibers primarily because they exhibit lower loss at these wavelengths. ZrF4 and InF3 fibers have a multi-phonon edge of ~3.6 µm and ~4.6 µm, respectively.
Contaminants in the fiber also contribute to the absorption loss. One example of an undesired impurity is water molecules that are trapped in the glass of the optical fiber, which will absorb light around 1300 nm and 2.94 µm. Since telecom signals and some lasers operate in that same region, any water molecules present in the fiber will attenuate the signal significantly.
The concentration of ions in the fiber glass is often controlled by manufacturers to tune the transmission/attenuation properties of a fiber. For example, hydroxyl ions (OH-) are naturally present in silica and absorb light in the NIR-IR spectrum. Therefore, fibers with low-OH content are preferred for transmission at telecom wavelengths. On the other hand, fibers with high-OH content typically exhibit increased transmission at UV wavelengths and thus may be preferred by users interested in applications such as fluorescence or UV-VIS spectroscopy.
Scattering
For the majority of fiber optics applications, light scattering is a source of loss that occurs when light encounters a change in the refractive index of the medium. These changes can be extrinsic, caused by impurities, particulates, or bubbles; or intrinsic, caused by fluctuations in the glass density, composition, or phase state. Scattering is inversely related to the wavelength of light, so scattering loss becomes significant at shorter wavelengths such as the UV or blue regions of the spectrum. Using proper fiber cleaning, handling, and storage procedures may minimize the presence of impurities on tips of fibers that cause large scattering losses.
Bending Loss
Losses that occur due to changes in the external and internal geometry of an optical fiber are known as bending loss. These are usually separated into two categories: macrobending loss and microbending loss.
Macrobend loss is typically associated with the physical bending of an optical fiber; for example, rolling it in a tight coil. As shown in the image to the right, guided light is spatially distributed within the core and cladding regions of the fiber. When a fiber is bent at a radius, light near the outer radius of the bend cannot maintain the same spatial mode profile without exceeding the speed of light. Instead, the energy is lost to the surroundings as radiation. For a large bend radius, the losses associated with bending are small; however, at bend radii smaller than the recommended bend radius of a fiber, bend losses become very significant. For short periods of time, optical fibers can be operated at a small bend radius; however, for long-term storage, the bend radius should be larger than the recommended value. Use proper storage conditions (temperature and bend radius) to reduce the likelihood of permanently damaging the fiber; the FSR1 Fiber Storage Reel is designed to minimize high bend loss.
Microbend loss arises from changes in the internal geometry of the fiber, particularly the core and cladding layers. These random variations (i.e., bumps) in the fiber structure disturb the conditions needed for total internal reflection, causing propagating light to couple into a non-propagating mode that leaks from the fiber (see the image to the right for details). Unlike macrobend loss, which is controlled by the bend radius, microbend loss occurs due to permanent defects in the fiber that are created during fiber manufacturing.
Cladding Modes
While most light in a multimode fiber is guided via TIR within the core of the fiber, higher-order modes that guide light within both the core and cladding layer, because of TIR at the cladding and coating/buffer interface, can also exist. This results in what is known as a cladding mode. An example of this can be seen in the beam profile measurement to the right, which shows cladding modes with a higher intensity in the cladding than in the core of the fiber. These modes can be non-propagating (i.e., they do not fulfill the conditions for TIR) or they can propagate over a significant length of fiber. Because cladding modes are typically higher-order, they are a source of loss in the presence of fiber bending and microbending defects. Cladding modes are also lost when connecting two fibers via connectors as they cannot be easily coupled between optical fibers.
Cladding modes may be undesired for some applications (e.g., launching into free space) because of their effect on the beam spatial profile. Over long fiber lengths, these modes will naturally attenuate. For short fiber lengths (<10 m), one method for removing cladding modes from a fiber is to use a mandrel wrap at a radius that removes cladding modes while keeping the desired propagating modes.
Launch Conditions
Underfilled Launch Condition
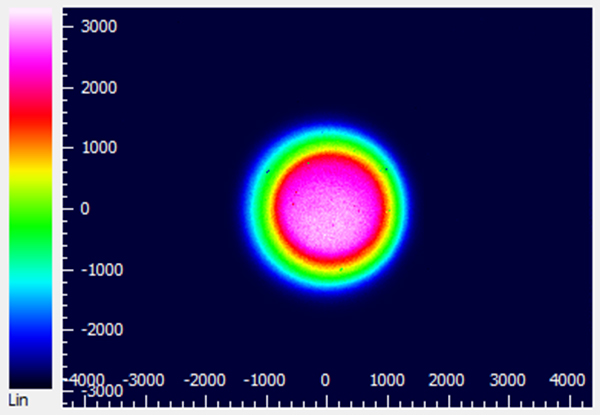
For a large multimode fiber which accepts light over a wide NA, the condition of the light (e.g., source type, beam diameter, NA) coupled into the fiber can have a significant effect on performance. An underfilled launch condition occurs when the beam diameter and NA of light at the coupling interface are smaller than the core diameter and NA of the fiber. A common example of this is launching a laser source into a large multimode fiber. As seen in the diagram and beam profile measurement below, underfilled launches tend to concentrate light spatially in the center of the fiber, filling lower-order modes preferentially over higher-order modes. As a result, they are less sensitive to macrobend losses and do not have cladding modes. The measured insertion loss for an underfilled launch tends to be lower than typical, with a higher power density in the core of the fiber.
Overfilled Launch Condition
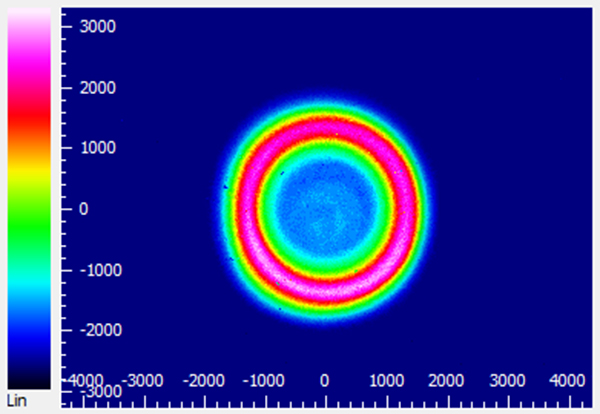
Overfilled launches are defined by situations where the beam diameter and NA at the coupling interface are larger than the core diameter and NA of the fiber. One method to achieve this is by launching light from an LED source into a small multimode fiber. An overfilled launch completely exposes the fiber core and some of the cladding to light, enabling the filling of lower- and higher-order modes equally (as seen in the images below) and increasing the likelihood of coupling into cladding modes of the fiber. This increased percentage of higher-order modes means that overfilled fibers are more sensitive to bending loss. The measured insertion loss for an overfilled launch tends to be higher than typical, but results in an overall higher output power compared to an underfilled fiber launch.
There are advantages and disadvantages to underfilled or overfilled launch conditions, depending on the needs of the intended application. For measuring the baseline performance of a multimode fiber, Thorlabs recommends using a launch condition where the beam diameter is 70-80% of the fiber core diameter. Over short distances, an overfilled fiber has more output power; however, over long distances (>10 - 20 m) the higher-order modes that more susceptible to attenuation will disappear.
| Quick Links |
|---|
| Damage at the Air / Glass Interface |
| Intrinsic Damage Threshold |
| Preparation and Handling of Optical Fibers |
Laser-Induced Damage in Silica Optical Fibers
The following tutorial details damage mechanisms relevant to unterminated (bare) fiber, terminated optical fiber, and other fiber components from laser light sources. These mechanisms include damage that occurs at the air / glass interface (when free-space coupling or when using connectors) and in the optical fiber itself. A fiber component, such as a bare fiber, patch cable, or fused coupler, may have multiple potential avenues for damage (e.g., connectors, fiber end faces, and the device itself). The maximum power that a fiber can handle will always be limited by the lowest limit of any of these damage mechanisms.
While the damage threshold can be estimated using scaling relations and general rules, absolute damage thresholds in optical fibers are very application dependent and user specific. Users can use this guide to estimate a safe power level that minimizes the risk of damage. Following all appropriate preparation and handling guidelines, users should be able to operate a fiber component up to the specified maximum power level; if no maximum is specified for a component, users should abide by the "practical safe level" described below for safe operation of the component. Factors that can reduce power handling and cause damage to a fiber component include, but are not limited to, misalignment during fiber coupling, contamination of the fiber end face, or imperfections in the fiber itself. For further discussion about an optical fiber’s power handling abilities for a specific application, please contact Thorlabs’ Tech Support.
Click to Enlarge
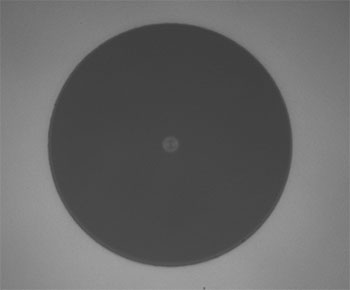
Undamaged Fiber End
Click to Enlarge
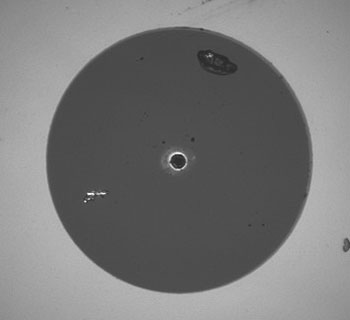
Damaged Fiber End
Damage at the Air / Glass Interface
There are several potential damage mechanisms that can occur at the air / glass interface. Light is incident on this interface when free-space coupling or when two fibers are mated using optical connectors. High-intensity light can damage the end face leading to reduced power handling and permanent damage to the fiber. For fibers terminated with optical connectors where the connectors are fixed to the fiber ends using epoxy, the heat generated by high-intensity light can burn the epoxy and leave residues on the fiber facet directly in the beam path.
| Estimated Optical Power Densities on Air / Glass Interfacea | ||
|---|---|---|
| Type | Theoretical Damage Thresholdb | Practical Safe Levelc |
| CW (Average Power) |
~1 MW/cm2 | ~250 kW/cm2 |
| 10 ns Pulsed (Peak Power) |
~5 GW/cm2 | ~1 GW/cm2 |
Damage Mechanisms on the Bare Fiber End Face
Damage mechanisms on a fiber end face can be modeled similarly to bulk optics, and industry-standard damage thresholds for UV Fused Silica substrates can be applied to silica-based fiber. However, unlike bulk optics, the relevant surface areas and beam diameters involved at the air / glass interface of an optical fiber are very small, particularly for coupling into single mode (SM) fiber. therefore, for a given power density, the power incident on the fiber needs to be lower for a smaller beam diameter.
The table to the right lists two thresholds for optical power densities: a theoretical damage threshold and a "practical safe level". In general, the theoretical damage threshold represents the estimated maximum power density that can be incident on the fiber end face without risking damage with very good fiber end face and coupling conditions. The "practical safe level" power density represents minimal risk of fiber damage. Operating a fiber or component beyond the practical safe level is possible, but users must follow the appropriate handling instructions and verify performance at low powers prior to use.
Calculating the Effective Area for Single Mode Fibers
The effective area for single mode (SM) fiber is defined by the mode field diameter (MFD), which is the cross-sectional area through which light propagates in the fiber; this area includes the fiber core and also a portion of the cladding. To achieve good efficiency when coupling into a single mode fiber, the diameter of the input beam must match the MFD of the fiber.
As an example, SM400 single mode fiber has a mode field diameter (MFD) of ~Ø3 µm operating at 400 nm, while the MFD for SMF-28 Ultra single mode fiber operating at 1550 nm is Ø10.5 µm. The effective area for these fibers can be calculated as follows:
SM400 Fiber: Area = Pi x (MFD/2)2 = Pi x (1.5 µm)2 = 7.07 µm2 = 7.07 x 10⁻⁸ cm2
SMF-28 Ultra Fiber: Area = Pi x (MFD/2)2 = Pi x (5.25 µm)2 = 86.6 µm2 = 8.66 x 10⁻⁷ cm2
To estimate the power level that a fiber facet can handle, the power density is multiplied by the effective area. Please note that this calculation assumes a uniform intensity profile, but most laser beams exhibit a Gaussian-like shape within single mode fiber, resulting in a higher power density at the center of the beam compared to the edges. Therefore, these calculations will slightly overestimate the power corresponding to the damage threshold or the practical safe level. Using the estimated power densities assuming a CW light source, we can determine the corresponding power levels as:
SM400 Fiber: 7.07 x 10⁻⁸ cm2 x 1 MW/cm2 = 7.1 x 10⁻⁸ MW = 71 mW (Theoretical Damage Threshold)
7.07 x 10⁻⁸ cm2 x 250 kW/cm2 = 1.8 x 10⁻⁵ kW = 18 mW (Practical Safe Level)
SMF-28 Ultra Fiber: 8.66 x 10⁻⁷ cm2 x 1 MW/cm2 = 8.7 x 10⁻⁷ MW = 870 mW (Theoretical Damage Threshold)
8.66 x 10⁻⁷ cm2 x 250 kW/cm2 = 2.1 x 10⁻⁴ kW = 210 mW (Practical Safe Level)
Effective Area of Multimode Fibers
The effective area of a multimode (MM) fiber is defined by the core diameter, which is typically far larger than the MFD of an SM fiber. For optimal coupling, Thorlabs recommends focusing a beam to a spot roughly 70 - 80% of the core diameter. The larger effective area of MM fibers lowers the power density on the fiber end face, allowing higher optical powers (typically on the order of kilowatts) to be coupled into multimode fiber without damage.
Damage Mechanisms Related to Ferrule / Connector Termination
 Click to Enlarge
Plot showing approximate input power that can be incident on a single mode silica optical fiber with a termination. Each line shows the estimated power level due to a specific damage mechanism. The maximum power handling is limited by the lowest power level from all relevant damage mechanisms (indicated by a solid line).
Fibers terminated with optical connectors have additional power handling considerations. Fiber is typically terminated using epoxy to bond the fiber to a ceramic or steel ferrule. When light is coupled into the fiber through a connector, light that does not enter the core and propagate down the fiber is scattered into the outer layers of the fiber, into the ferrule, and the epoxy used to hold the fiber in the ferrule. If the light is intense enough, it can burn the epoxy, causing it to vaporize and deposit a residue on the face of the connector. This results in localized absorption sites on the fiber end face that reduce coupling efficiency and increase scattering, causing further damage.
For several reasons, epoxy-related damage is dependent on the wavelength. In general, light scatters more strongly at short wavelengths than at longer wavelengths. Misalignment when coupling is also more likely due to the small MFD of short-wavelength SM fiber that also produces more scattered light.
To minimize the risk of burning the epoxy, fiber connectors can be constructed to have an epoxy-free air gap between the optical fiber and ferrule near the fiber end face. Our high-power multimode fiber patch cables use connectors with this design feature.
Determining Power Handling with Multiple Damage Mechanisms
When fiber cables or components have multiple avenues for damage (e.g., fiber patch cables), the maximum power handling is always limited by the lowest damage threshold that is relevant to the fiber component. In general, this represents the highest input power that can be incident on the patch cable end face and not the coupled output power.
As an illustrative example, the graph to the right shows an estimate of the power handling limitations of a single mode fiber patch cable due to damage to the fiber end face and damage via an optical connector. The total input power handling of a terminated fiber at a given wavelength is limited by the lower of the two limitations at any given wavelength (indicated by the solid lines). A single mode fiber operating at around 488 nm is primarily limited by damage to the fiber end face (blue solid line), but fibers operating at 1550 nm are limited by damage to the optical connector (red solid line).
In the case of a multimode fiber, the effective mode area is defined by the core diameter, which is larger than the effective mode area for SM fiber. This results in a lower power density on the fiber end face and allows higher optical powers (on the order of kilowatts) to be coupled into the fiber without damage (not shown in graph). However, the damage limit of the ferrule / connector termination remains unchanged and as a result, the maximum power handling for a multimode fiber is limited by the ferrule and connector termination.
Please note that these are rough estimates of power levels where damage is very unlikely with proper handling and alignment procedures. It is worth noting that optical fibers are frequently used at power levels above those described here. However, these applications typically require expert users and testing at lower powers first to minimize risk of damage. Even still, optical fiber components should be considered a consumable lab supply if used at high power levels.
Intrinsic Damage Threshold
In addition to damage mechanisms at the air / glass interface, optical fibers also display power handling limitations due to damage mechanisms within the optical fiber itself. These limitations will affect all fiber components as they are intrinsic to the fiber itself. Two categories of damage within the fiber are damage from bend losses and damage from photodarkening.
Bend Losses
Bend losses occur when a fiber is bent to a point where light traveling in the core is incident on the core/cladding interface at an angle higher than the critical angle, making total internal reflection impossible. Under these circumstances, light escapes the fiber, often in a localized area. The light escaping the fiber typically has a high power density, which burns the fiber coating as well as any surrounding furcation tubing.
A special category of optical fiber, called double-clad fiber, can reduce the risk of bend-loss damage by allowing the fiber’s cladding (2nd layer) to also function as a waveguide in addition to the core. By making the critical angle of the cladding/coating interface higher than the critical angle of the core/clad interface, light that escapes the core is loosely confined within the cladding. It will then leak out over a distance of centimeters or meters instead of at one localized spot within the fiber, minimizing the risk of damage. Thorlabs manufactures and sells 0.22 NA double-clad multimode fiber, which boasts very high, megawatt range power handling.
Photodarkening
A second damage mechanism, called photodarkening or solarization, can occur in fibers used with ultraviolet or short-wavelength visible light, particularly those with germanium-doped cores. Fibers used at these wavelengths will experience increased attenuation over time. The mechanism that causes photodarkening is largely unknown, but several fiber designs have been developed to mitigate it. For example, fibers with a very low hydroxyl ion (OH) content have been found to resist photodarkening and using other dopants, such as fluorine, can also reduce photodarkening.
Even with the above strategies in place, all fibers eventually experience photodarkening when used with UV or short-wavelength light, and thus, fibers used at these wavelengths should be considered consumables.
Preparation and Handling of Optical Fibers
General Cleaning and Operation Guidelines
These general cleaning and operation guidelines are recommended for all fiber optic products. Users should still follow specific guidelines for an individual product as outlined in the support documentation or manual. Damage threshold calculations only apply when all appropriate cleaning and handling procedures are followed.
-
All light sources should be turned off prior to installing or integrating optical fibers (terminated or bare). This ensures that focused beams of light are not incident on fragile parts of the connector or fiber, which can possibly cause damage.
-
The power-handling capability of an optical fiber is directly linked to the quality of the fiber/connector end face. Always inspect the fiber end prior to connecting the fiber to an optical system. The fiber end face should be clean and clear of dirt and other contaminants that can cause scattering of coupled light. Bare fiber should be cleaved prior to use and users should inspect the fiber end to ensure a good quality cleave is achieved.
-
If an optical fiber is to be spliced into the optical system, users should first verify that the splice is of good quality at a low optical power prior to high-power use. Poor splice quality may increase light scattering at the splice interface, which can be a source of fiber damage.
-
Users should use low power when aligning the system and optimizing coupling; this minimizes exposure of other parts of the fiber (other than the core) to light. Damage from scattered light can occur if a high power beam is focused on the cladding, coating, or connector.
Tips for Using Fiber at Higher Optical Power
Optical fibers and fiber components should generally be operated within safe power level limits, but under ideal conditions (very good optical alignment and very clean optical end faces), the power handling of a fiber component may be increased. Users must verify the performance and stability of a fiber component within their system prior to increasing input or output power and follow all necessary safety and operation instructions. The tips below are useful suggestions when considering increasing optical power in an optical fiber or component.
-
Splicing a fiber component into a system using a fiber splicer can increase power handling as it minimizes possibility of air/fiber interface damage. Users should follow all appropriate guidelines to prepare and make a high-quality fiber splice. Poor splices can lead to scattering or regions of highly localized heat at the splice interface that can damage the fiber.
-
After connecting the fiber or component, the system should be tested and aligned using a light source at low power. The system power can be ramped up slowly to the desired output power while periodically verifying all components are properly aligned and that coupling efficiency is not changing with respect to optical launch power.
-
Bend losses that result from sharply bending a fiber can cause light to leak from the fiber in the stressed area. When operating at high power, the localized heating that can occur when a large amount of light escapes a small localized area (the stressed region) can damage the fiber. Avoid disturbing or accidently bending fibers during operation to minimize bend losses.
-
Users should always choose the appropriate optical fiber for a given application. For example, large-mode-area fibers are a good alternative to standard single mode fibers in high-power applications as they provide good beam quality with a larger MFD, decreasing the power density on the air/fiber interface.
-
Step-index silica single mode fibers are normally not used for ultraviolet light or high-peak-power pulsed applications due to the high spatial power densities associated with these applications.
| Posted Comments: | |
| No Comments Posted |
| Quick Links | |||
|---|---|---|---|
| Single-Site Stimulation | |||
| One Light Source to One Cannula Implant | |||
| Multilateral Stimulation | |||
| One Light Source to Two Cannula Implants Using Rotary Joint Splitter | |||
| One or Two Light Sources to Two Cannula Implants | |||
| One Light Source to Seven Cannula Implants | |||
| Two Light Sources into One Dual-Core Cannula Implant | |||
| Illumination | |||
| Fiber-Coupled LEDs and Drivers | |||
Optogenetics Selection Guide
Thorlabs offers a wide range of optogenetics components; the compatibility of these products in select standard configurations is discussed in detail here. Please contact Technical Support for assistance with items outside the scope of this guide, including custom fiber components for optogenetics.
Single-Site Stimulation
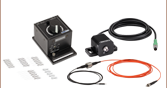
One Light Source to One Cannula Implant
The most straightforward method for in vivo light stimulation of a specimen is to use a single fiber optic with a single LED light source. The single wavelength LED is powered by an LED driver, and then the illumination output is fiber-coupled into a patch cable, which connects to the implanted cannula. See the graphics and expandable compatibility tables below for the necessary patch cables and cannulae to create this setup. To choose the appropriate LED and driver, see below or the full web presentation.
Click on Each Component for More Information
Click to See Ø1.25 mm (LC) Ferrule Compatible Patch Cables, Cannulae, and Interconnects
Click to See Ø2.5 mm (FC) Ferrule Compatible Patch Cables, Cannulae, and Interconnects
Multilateral Stimulation
The ability to accurately and simultaneously direct light to multiple locations within a specimen is desired for many types of optogenetics experiments. For example, bilateral stimulation techniques typically target neurons in two spatially separated regions in order to induce a desired behavior. In more complex experiments involving the simultaneous inhibition and stimulation of neurons, delivering light of two different monochromatic wavelengths within close proximity enables the user to perform these experiments without implanting multiple cannulae, which can increase stress on the specimen.
Multilateral stimulation can be achieved with several different configurations depending on the application requirements. The sections below illustrate examples of different configurations using Thorlabs' optogenetics products.
Option 1: One Light Source to Two Cannula Implants Using Rotary Joint Splitter
Thorlabs' RJ2 1x2 Rotary Joint Splitter is designed for optogenetics applications and is used to split light from a single input evenly between two outputs. The rotary joint interface allows connected patch cables to freely rotate, reducing the risk of fiber damage caused by a moving specimen. See the graphic and compatibility table below for the necessary cables and cannulae to create this setup. For LEDs and drivers, see below or the full web presentation.
Click to See Ø1.25 mm (LC) Ferrule Components Recommended for Use with RJ2 Rotary Joint Splitter
Click to See Ø2.5 mm (FC) Ferrule Components Recommended for Use with RJ2 Rotary Joint Splitter
Option 2: One or Two Light Sources to Two Cannula Implants
If the intent is for one LED source to connect to two cannulae for simultaneous light modulation, then a bifurcated fiber bundle can be used to split the light from the LED into each respective cannula. For dual wavelength stimulation (mixing two wavelengths in a single cannula) or a more controlled split ratio between cannula, one can use a multimode coupler to connect one or two LEDs to the cannulae. If one cable end is left unused, the spare coupler cable end may be terminated by a light trap. See the graphic and compatibility table below for the necessary cables and cannulae to create this setup. For LEDs and drivers, see below or the full web presentation.
Click on Each Component Below for More Information
Option 3: One Light Sources to Seven Cannula Implants
If the intent is for one LED source to connect to seven cannulae for simultaneous light modulation, then a 1-to-7 fiber bundle can be used to split the light from the LED into each respective cannula. See the graphic and compatibility table below for the necessary cables and cannulae to create this setup. For LEDs and drivers, see below or the full web presentation.
Click on Each Component Below for More Information
Two Light Sources into One Dual-Core Cannula Implant
For bilateral stimulation applications where the two cannulas need to be placed in close proximity (within ~1 mm), Thorlabs offers dual-core patch cables and cannulae that are designed for this specific application. Each core is driven by a separate light source, enabling users to stimulate and/or supress nerve cells in the same region of the specimen. See the graphic and compatibility table below for the necessary cables and cannulae to create this setup. For LEDs and drivers, see below or the full web presentation.
Click on Each Component for More Information
| Part Selection Table (Click Links for Item Description Popup) | |||||||||
|---|---|---|---|---|---|---|---|---|---|
| Common Fiber Properties | |||||||||
| Core Diameter | 200 µm | ||||||||
| Wavelength Range | 400 - 2200 nm | ||||||||
| NA | 0.39 | ||||||||
| Fiber Type | FT200EMT | ||||||||
| Ferrule Stylea | FC (Ø2.5 mm) | ||||||||
| Dual-Core Patch Cable | FC/PC Input | BFY32FL1 | |||||||
| SMA905 Input | BFY32SL1 | ||||||||
| Compatible Mating Sleeve/Interconnect | ADAF1 ADAF2 ADAF4-5 |
||||||||
| Dual-Core Fiber Optic Cannulaec | Stainless Steel | CFM32L10 CFM32L20 |
|||||||
| LED Item # | Wavelengtha | Typical Opsin | Output Powerb | Color |
|---|---|---|---|---|
| M405F3c | 405 nm | mmilCFP, hcriGFP | 3.7 mW | UV |
| M430F1 | 430 nm | ChR2 | 7.5 mW | Violet |
| M455F3 | 455 nm | ChIEF, bPAC | 24.5 mW | Royal Blue |
| M470F4 | 470 nm | ChR2, ChR2-SFO | 20 mW | Blue |
| M490F4 | 490 nm | Rh-CT, ChR2 (E123A) | 2.8 mW | Blue |
| M505F3 | 505 nm | ChRGR, Opto-α1AR, Opto-β2AR | 11.7 mW | Cyan |
| M530F3 | 530 nm | C1V1, VChR1 | 9.6 mW | Green |
| M565F3 | 565 nm | Arch, VChR1-SFO | 13.5 mW | Lime |
| M595F2 | 595 nm | ChR2-SFO, eNpHR3.0 | 11.5 mW | Amber |
| M625F2 | 625 nm | ReChR | 17.5 mW | Red |
Illumination
Click to Enlarge
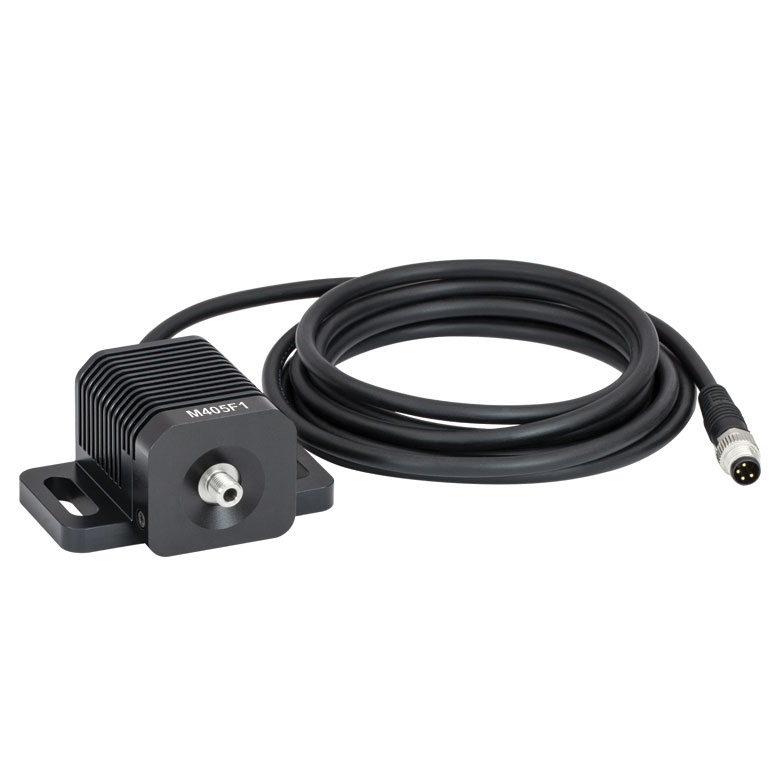
M405F1
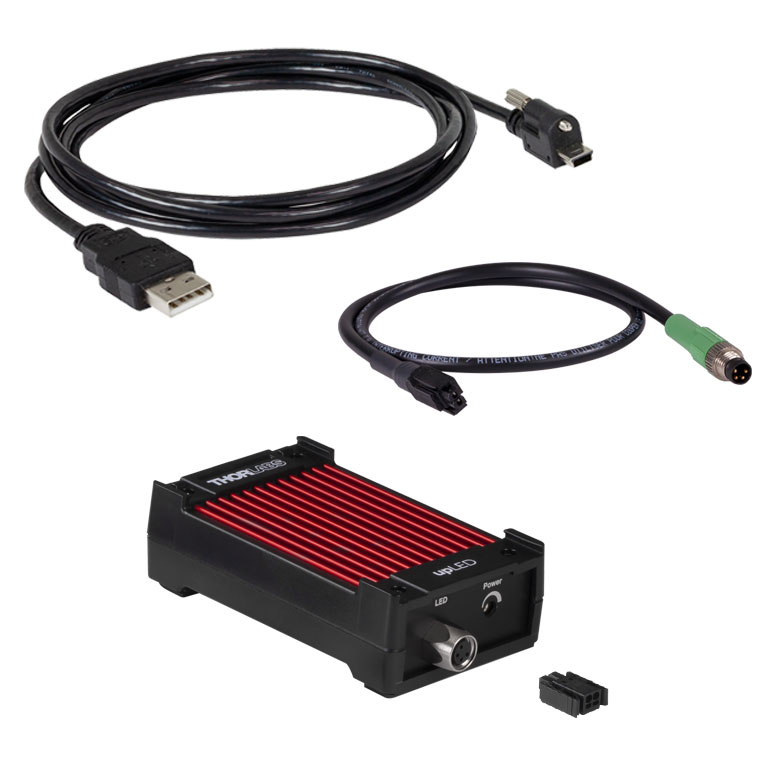
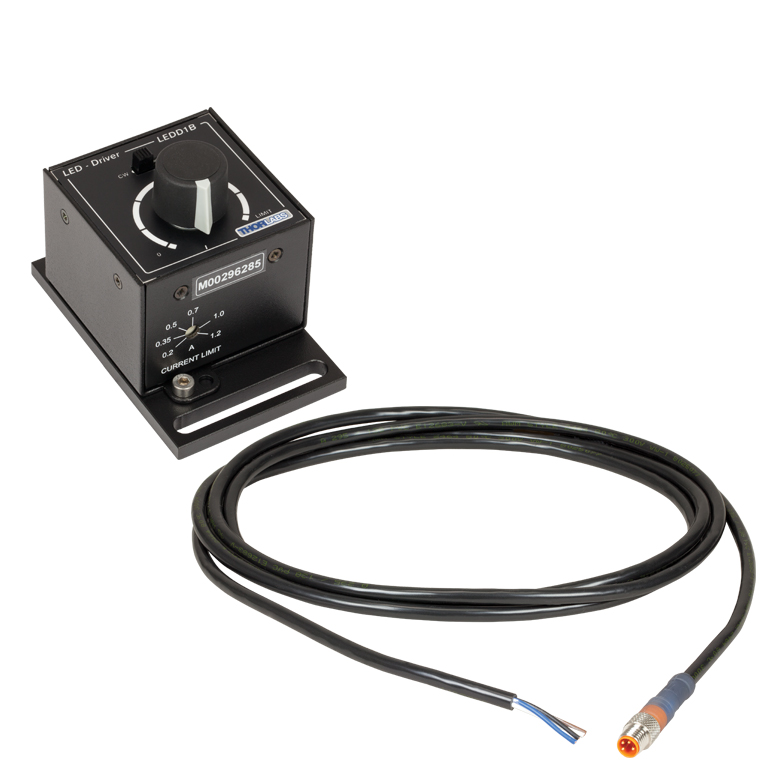
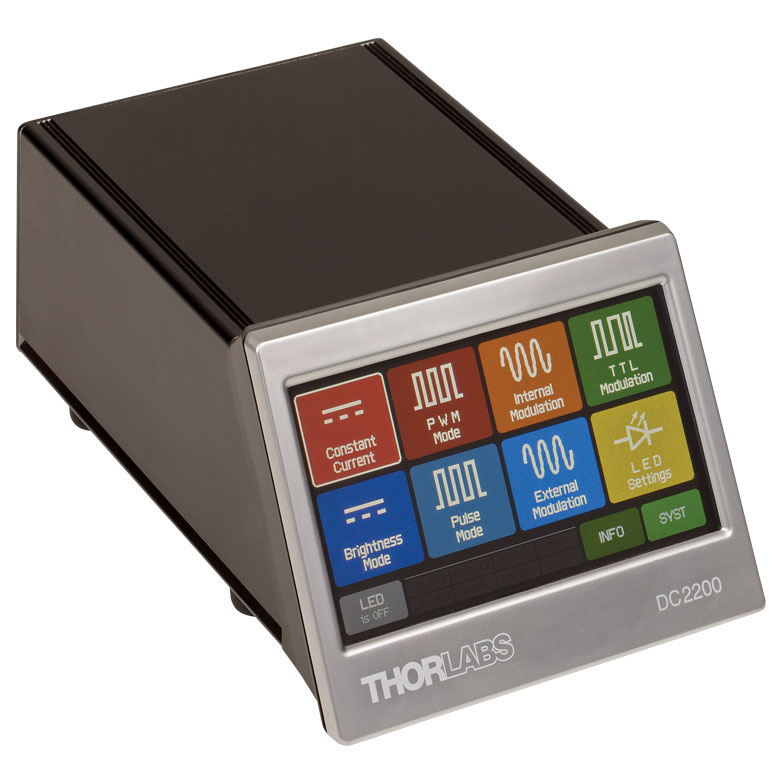
Fiber-Coupled LEDs and Drivers
Our fiber-coupled LEDs are ideal light sources for optogenetics applications. They feature a variety of wavelength choices and a convenient interconnection to optogenetics patch cables. Thorlabs offers fiber-coupled LEDs with nominal wavelengths ranging from 280 nm to 1050 nm. See the table to the right for the LEDs with the most popular wavelengths for optogenetics. A table of compatible LED drivers can be viewed by clicking below.

 Ferrule Patch Cables")
 Zoom
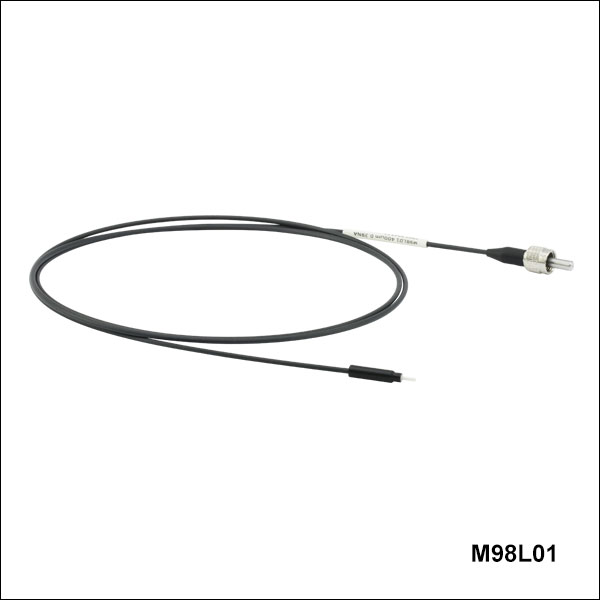
Zoom- Optogenetics Patch Cables with Ø1.25 mm Ferrule on One End
- Use with Ø400 µm Core, 0.39 NA Cannulae
- Compatible with ADAL1 Mating Sleeve or ADAL3 Interconnect
| Item # | Input Connector | Output Ferrule | Ferrule Material | Cable Length | Cable Mass | Jacket |
|---|---|---|---|---|---|---|
| M98L01 | SMA905 | Ø1.25 mm | Ceramic (Zirconia) |
1 m | 8.6 g | Ø1/16" Heat-Shrink Tubing |
| M99L01 | FC/PC | 1 m | 8.6 g |
 Ferrule Patch Cables")
 Zoom
Zoom
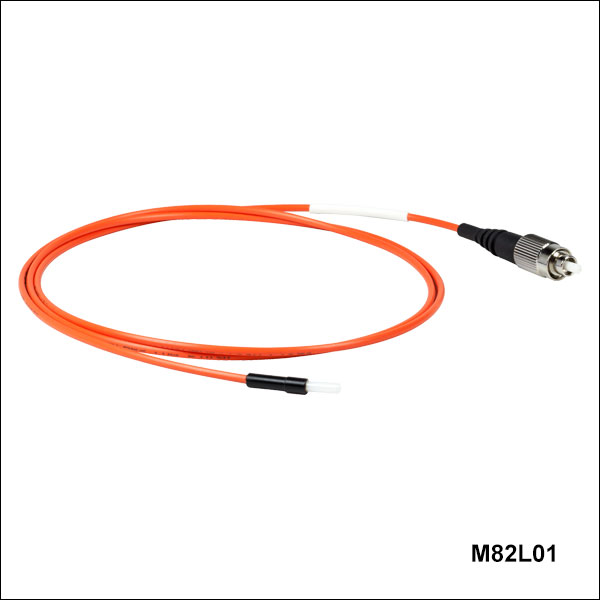
- Optogenetics Patch Cables with Ø2.5 mm Ferrule on One End
- Use with Ø400 µm Core, 0.39 NA Cannulae
- Compatible with ADAF1 Mating Sleeve or ADAF2 Interconnect
| Item # | Input Connector | Output Ferrule | Ferrule Material | Cable Length | Cable Mass | Jacket |
|---|---|---|---|---|---|---|
| M79L005 | SMA905 | Ø2.5 mm | Ceramic (Zirconia) |
0.5 m | 20 g | Ø2 mm PVC FT020 |
| M79L01 | 1 m | 20 g | ||||
| M82L005 | FC/PC | 0.5 m | 20 g | |||
| M82L01 | 1 m | 20 g |