Fiber Coupler Tutorials

Please Wait
Browse Our Selection of Single Mode
and Multimode 1x2 Fiber Couplers
Definition of 1x2 Fused Fiber Optic Coupler Specifications
This tab provides a brief explanation of how we determine several key specifications for our 1x2 couplers. 1x2 couplers are manufactured using the same process as our 2x2 fiber optic couplers, except the second input port is internally terminated using a proprietary method that minimizes back reflections. For combining light of different wavelengths, Thorlabs offers a line of single mode wavelength division multiplexers (WDMs). The ports on our 1x2 couplers are configured as shown in Figure 1A.
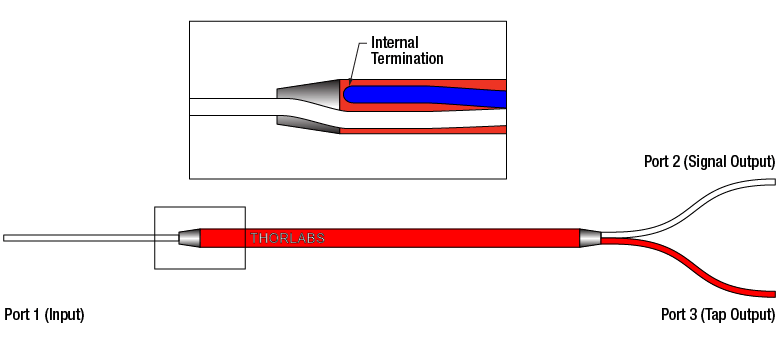
Figure 1A 1x2 Coupler Schematic
Excess Loss
Excess loss in dB is determined by the ratio of the total input power to the total output power:

Pport1 is the input power at port 1 and Pport2+Pport3 is the total output power from Ports 2 and 3. All powers are expressed in mW.
Polarization Dependent Loss (PDL)
The polarization dependent loss is defined as the ratio of the maximum and minimum transmissions due to polarization states in couplers. This specification pertains only to couplers not designed for maintaining polarization. PDL is always specified in decibels (dB), and can be calculated with the following equation:

where Pmax is the maximum power able to be transmitted through the coupler when scanning across all possible polarization states. Pmin is the minimum transmission across those same states.
Optical Return Loss (ORL) / Directivity
The directivity refers to the fraction of input light that is lost in the internally terminated fiber end within the coupler housing when port 1 is used as the input. It can be calculated in units of dB using the following equation:

where Pport1 and Pport1b are the optical powers (in mW) in port 1 and the internally terminated fiber, respectively. This output is the result of back reflection at the junction of the legs of the coupler and represents a loss in the total light output at ports 2 and 3. For a 50:50 coupler, the directivity is equal to the optical return loss (ORL).
Insertion Loss
The insertion loss is defined as the ratio of the input power to the output power at one of the output legs of the coupler (signal or tap). Insertion loss is always specified in decibels (dB). It is generally defined using the following equation:

where Pin and Pout are the input and output powers (in mW). For our 1x2 couplers, the insertion loss specification is provided for both signal and tap outputs; our specifications always list insertion loss for the signal output first. To define the insertion loss for a specific output (port 2 or port 3), the equation is rewritten as:
![]()
![]()
Insertion loss inherently includes both coupling (e.g., light transferred to the other output leg) and excess loss (e.g., light lost from the coupler) effects. The maximum allowed insertion loss for each output, signal and tap, are both specified. Because the insertion loss in each output is correlated to light coupled to the other output, no coupler will ever have the maximum insertion loss in both outputs simultaneously.
Calculating Insertion Loss using Power Expressed in dBm
Insertion loss can also be easily calculated with the power expressed in units of dBm. The following equation shows the relationship between power expressed in mW and dBm:
![]()
Then, the insertion loss in dB can be calculated as follows:
![]()

Click to Enlarge
Figure 1B A graphical representation of the coupling ratio calculation.
Coupling Ratio
Insertion loss (in dB) is the ratio of the input power to the output power from each leg of the coupler as a function of wavelength. It captures both the coupling ratio and the excess loss. The coupling ratio is calculated from the measured insertion loss. Coupling ratio (in %) is the ratio of the optical power from each output port (ports 2 and 3) to the sum of the total power of both output ports as a function of wavelength. Path A represents light traveling from port 1 to port 2 while Path B represents light traveling from port 1 to port 3. It is not impacted by spectral features such as the water absorption region because both output legs are affected equally.
Uniformity
The uniformity is also calculated from the measured insertion loss. Uniformity is the variation (in dB) of the insertion loss over the bandwidth. It is a measure of how evenly the insertion loss is distributed over the spectral range. The uniformity of Path A is the difference between the value of highest insertion loss and the solid red insertion loss curve (in Figure 1B). The uniformity of Path B is the difference between the solid blue insertion loss curve and the value of lowest insertion loss.
Browse Our Selection of Single Mode
and Multimode 2x2 Fiber Couplers
Definition of 2x2 Fused Fiber Optic Coupler Specifications
This tab provides a brief explanation of how we determine several key specifications for our 2x2 couplers. The ports of the coupler are defined as shown in Figure 3A. In the sections below, the light is input into port 1. Port 3 and port 4 would then be considered the signal and tap outputs, respectively.
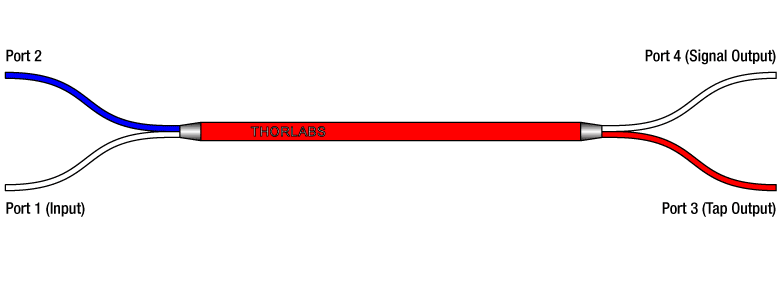
Figure 3A 2x2 Coupler Schematic
Excess Loss
Excess loss in dB is determined by the ratio of the total input power to the total output power:

Pport1 is the input power at port 1 and Pport3+Pport4 is the total output power from ports 3 and 4, assuming no input power at port 2. All powers are expressed in mW.
Polarization Dependent Loss (PDL)
The polarization dependent loss is defined as the ratio of the maximum and minimum transmissions due to polarization states in couplers. This specification pertains only to couplers not designed for maintaining polarization. PDL is always specified in decibels (dB), and can be calculated with the following equation:

where Pmax is the maximum power able to be transmitted through the coupler when scanning across all possible polarization states. Pmin is the minimum transmission across those same states.
Optical Return Loss (ORL) / Directivity
The directivity refers to the fraction of input light that exits the coupler through an input port (i.e., light exiting at port 2) instead of the intended output port. It can be calculated in units of dB using the following equation:

where Pport1 and Pport2 are the optical powers (in mW) in port 1 and port 2, respectively. This output is the result of back reflection at the junction of the legs of the coupler and represents a loss in the total light output at ports 3 and 4. For a 50:50 coupler, the directivity is equal to the optical return loss (ORL).
Insertion Loss
The insertion loss is defined as the ratio of the input power to the output power at one of the output legs of the coupler (signal or tap). Insertion loss is always specified in decibels (dB). It is generally defined using the following equation:

where Pin and Pout are the input and output powers (in mW). For our 2x2 couplers, the insertion loss specification is provided for both signal and tap outputs; our specifications always list insertion loss for the signal output first. To define the insertion loss for a specific output (port 3 or port 4), the equation is rewritten as:


A similar equation can be used to define the insertion loss at port 2 for input at port 1. However, as seen above, this is already defined as the directivity of the coupler.
Insertion loss inherently includes both coupling (e.g., light transferred to the other output leg) and excess loss (e.g., light lost from the coupler) effects. The maximum allowed insertion loss for each output, signal and tap, are both specified. Because the insertion loss in each output is correlated to light coupled to the other output, no coupler will ever have the maximum insertion loss in both outputs simultaneously.
Calculating Insertion Loss using Power Expressed in dBm
Insertion loss can also be easily calculated with the power expressed in units of dBm. The following equation shows the relationship between power expressed in mW and dBm:
![]()
Then, the insertion loss in dB can be calculated as follows:
![]()

Click to Enlarge
Figure 3B A graphical representation of the coupling ratio calculation.
Coupling Ratio
Insertion loss (in dB) is the ratio of the input power to the output power from each leg of the coupler as a function of wavelength. It captures both the coupling ratio and the excess loss. The coupling ratio is calculated from the measured insertion loss. Coupling ratio (in %) is the ratio of the optical power from each output port (A and B) to the sum of the total power of both output ports as a function of wavelength. It is not impacted by spectral features such as the water absorption region because both output legs are affected equally.

Click to Enlarge
Figure 3C A graphical representation of the Uniformity calculation.
Uniformity
The uniformity is also calculated from the measured insertion loss. Uniformity is the variation (in dB) of the insertion loss over the bandwidth. It is a measure of how evenly the insertion loss is distributed over the spectral range. The uniformity of Path A is the difference between the value of highest insertion loss and the solid red insertion loss curve (in Figure 3B). The uniformity of Path B is the difference between the solid blue insertion loss curve and the value of lowest insertion loss.
General Coupling Examples
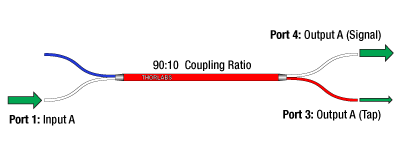
2x2 fused fiber optic couplers can split or mix light between two optical fibers with minimal loss and at a specified coupling ratio. Thorlabs' couplers are available from stock in one of four ratios: 50:50, 75:25, 90:10, or 99:1. All of our fused fiber optic couplers are bidirectional, meaning that all ports can be used as an input. Video 2A shows several simple coupling examples.
The terms "Signal Output" and "Tap Output" refer to the higher and lower power outputs, respectively. To illustrate this, if light is input into the white port of the TW1064R1A2A coupler (99:1 coupling ratio), 99% of the transmitted light is coupled into the white port on the other side of the coupler while the other 1% is coupled into the red port. In this example, the second white port is referred to as the signal output port, and the red port is referred to as a tap output port. For a 50:50 coupler, the signal and tap ports would have the same power output.
In our couplers with a red housing, the signal always propagates from blue to red or white to white, while the tap always propagates from blue to white or white to red. For other couplers, please refer to the datasheet included with the coupler to determine signal and tap propagation paths.
| Table 2B Insertion Loss | ||
|---|---|---|
| Coupling Ratio | Insertion Loss (Signal) | Insertion Loss (Tap) |
| 90:10 | 0.6 dB | 10.1 dB |
| 50:50 | 3.2 dB | 3.2 dB |
Specific Coupling Examples
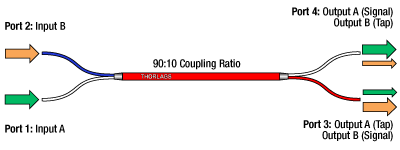
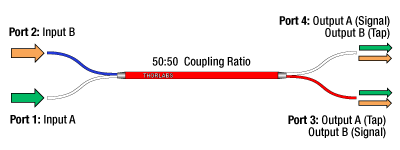
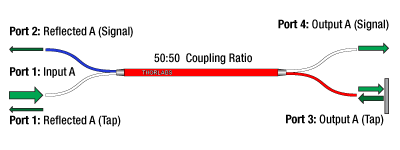
In the examples below, two 2x2 1300 nm Wideband Fiber Optic Couplers (50:50 and 90:10 coupling ratios) are used with input signals A and B. Table 2B lists typical insertion loss (signal and tap outputs) for each coupler. To calculate the power at any given output, subtract the insertion loss for the signal or tap output from the input power (in dBm).
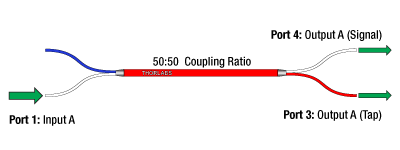
Example 1: Splitting Light from a Single Input
For this example, the couplers are used to split light from a single input into the signal and tap outputs as indicated in the diagrams in Table 2C. The rows of Table 2C detailing the output ports are highlighted in green.
Example 2: Mixing Two Signals from Two Inputs
In this example, the couplers are used to mix light from two inputs, designated Signal A and Signal B. The outputs contain a mixed signal composed of both Signal A and Signal B in ratios depending on the coupling ratio. All ports are indicated in the diagrams in Table 2D. The rows of Table 2D detailing the output ports are highlighted in green.
Example 3: Coupling a Return Signal with a Reflector on Port 3
Here, the couplers are used to split light from a single input, however, in this example there is a 100% reflector on port 3, as shown in the diagrams in Table 2E. As a result, the light is reflected back into the coupler and split again. The ports are indicated in the diagrams in Table 2E. The rows of Table 2E detailing the output ports are highlighted in green.
Browse Our Selection of Singlemode 1x4 Fiber Couplers
Definition of 1x4 Fused Fiber Optic Coupler Specifications
This tab provides a brief explanation of how we determine several key specifications for our 1x4 couplers. 1x4 couplers are manufactured using three 50:50 couplers internally to split the input signal evenly among four outputs (as shown in the schematic below). Any unused ports are terminated using a proprietary method that reduces back reflections. 1x4 couplers are not recommended for light combining applications and should only be used to split light. For combining light of different wavelengths, Thorlabs offers a line of wavelength division multiplexers (WDMs). The ports on our 1x4 couplers are configured as shown in Figure 4.1.
 Figure 4.1 Schematic of a 1x4 Fused Fiber Optic Coupler
Excess Loss
Excess loss in dB is determined by the ratio of the total input power to the total output power:

Pinput is the input power and Pport1+Pport2+Pport3+Pport4 is the total output power. All powers are expressed in mW.
Optical Return Loss (ORL) / Directivity
The directivity refers to the fraction of input light that is lost in the internally terminated fiber ends within the coupler housing. It can be calculated in units of dB using the following equation:

where Pt1, Pt2, and Pt3 are the optical powers (in mW) in the internally terminated fiber ends shown in the image above. This is the result of back reflections at each coupler junction and represents a loss in the total light output at the output ports. For a 1x4 coupler with an even split, the directivity is equal to the optical return loss (ORL).
Insertion Loss
The insertion loss is defined as the ratio of the input power to the output power at one of the output legs of the coupler. Insertion loss is always specified in decibels (dB). It is generally defined using the equation below:

where Pin and Pout are the input and output powers (in mW). For our 1x4 couplers, the insertion loss specification is provided for each output port. To define the insertion loss for a specific output (e.g., port 1 or port 2), the equation is rewritten as:


Insertion loss inherently includes both coupling (e.g., light transferred to the other output leg) and excess loss (e.g., light lost from the coupler) effects. The maximum allowed insertion loss for each output is specified. Because the insertion loss in each output is correlated to light coupled to the other outputs, no coupler will ever have the maximum insertion loss in all outputs simultaneously.
Calculating Insertion Loss using Power Expressed in dBm
Insertion loss can also be easily calculated with the power expressed in units of dBm. The equation below shows the relationship between power expressed in mW and dBm:

Then, the insertion loss in dB can be calculated as follows:

Coupling Ratio
Insertion loss (in dB) is the ratio of the input power to the output power from each leg of the coupler as a function of wavelength. It captures both the coupling ratio and the excess loss. The coupling ratio is calculated from the measured insertion loss. Coupling ratio (in %) is the ratio of the optical power from each output port to the sum of the total power of all output ports as a function of wavelength. It is not impacted by spectral features such as the water absorption region because all output legs are affected equally.
Uniformity
The uniformity is also calculated from the measured insertion loss. Uniformity is the variation (in dB) of the insertion loss over the bandwidth as a function of wavelength. It is a measure of how evenly the insertion loss is distributed over the spectral range. The uniformity is defined as the difference between the insertion loss in one output leg at a given wavelength and the highest or lowest value of insertion loss over the specified wavelength range in that same output leg.
| Posted Comments: | |
sbastien
(posted 2017-12-14 06:08:01.86) In the Fiber Coupler Tutorials, in the 2x2 Coupling Examples, I think there is an error with the image of the 90:10 Coupling Ratio in the Example 2.
The Output A is defined twice as the Signal output, and the Output B is is defined twice as the Tap output. This do not match the arrows in the image, neither the logic defined previously in the tutorial. tcampbell
(posted 2017-12-20 10:09:39.0) Hello, thank you for pointing out this error. We have updated the image with the proper labels. Feel free to contact us if you notice any more errors on our website. |
 Products Home

 Fused Fiber Optic Couplers