

Position-Sensing Detectors

- Lateral Effect and Segmented-Quadrant Sensors
- Compact Footprint
- Compatible with SM05 (0.535"-40) Lens Tubes
PDP90A
2D Lateral
Effect Detector
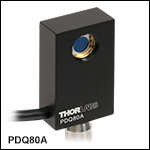
PDQ80A
Segmented
Quadrant Detector
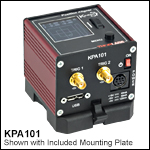
KPA101
K-Cube® Controller
Sensor and Controller Sold Separately
OVERVIEW

Features
- Lateral Position-Sensing Detector
- Wavelength Range: 320 - 1100 nm
- Insensitive to Beam Shape and Power Density
- Segmented-Quadrant Position-Sensing Detector
- Available Wavelength Ranges: 400 - 1050 nm or 1000 - 1700 nm
- Ideal for Automatic Alignment Applications
- Compatible with SM05 (0.535"-40) Lens Tubes
- Compact Footprint: 2.00" x 1.20" x 0.65" (50.8 mm x 30.5 mm x 16.5 mm)
- KPA101 Position-Sensing Detector Auto Aligner Available Separately Below
Thorlabs offers Position-Sensing Detectors (PSDs) that provide precise position measurements of incident beams. The PDP90A detector is a lateral effect PSD and utilizes a silicon photodiode-based tetra lateral sensor to accurately measure the displacement of an incident beam relative to the calibrated center. The detector is sensitive to wavelengths from 320 - 1100 nm and is ideal for measuring the movement of a beam, the distance traveled, or as feedback for alignment systems. The PDQ80A and PDQ30C detectors are segmented-quadrant PSDs and are sensitive to light in the 400 - 1050 nm or 1000 - 1700 nm range, respectively. Their detectors are comprised of four quadrant-shaped photodiodes, and the position of an incident beam is measured by comparing the intensity in each quadrant. These detectors are highly accurate and are ideal for auto-alignment applications. Please see the Operation tab for more information.
These PSDs have a compact design measuring 2.00" x 1.20" x 0.65" (50.8 mm x 30.5 mm x 16.5 mm) and feature internal SM05 (0.535"-40) threads, allowing for easy integration into SM05 lens tube systems. The detectors are also packaged with an 8-32 to M4 adapter to provide compatibility with either imperial or metric mounting posts.
All of the PSDs on this page are compatible with the KPA101 controller, available separately below. The KPA101 K-Cube® Beam Position Aligner is a part of Thorlabs' Kinesis® line of high-end, compact motion controllers. It interfaces with our range of Quadrant and Lateral Effect Sensor Heads and can be used either to measure the position of the beam on the sensor (in open-loop mode) or to generate a signal that can be used as the input for an automated beam steering element (in closed-loop mode). When combined with one or more KPC101 K-Cube Piezo Controller and Strain Gauge Readers, this unit is ideal for such closed-loop beam-steering applications.
SPECS
| Item # | PDP90A |
|---|---|
| Electrical Specifications | |
| Wavelength Range | 320 to 1100 nm |
| Peak Responsivity | 0.6 A/W @ 960 nm |
| Resolutiona | 0.75 µm |
| Voltage Noiseb | <2 mVpp, <300 µVrms |
| Position Displacement Errorc | ±250 µm |
| Transimpedance Gain | 100 kV/A |
| Photocurrent | 40 µA (Max) |
| Output Voltage Range | Pins 1 and 2: -4 V to 4 V Pin 3: 0 to 4 V |
| Signal Output Offset | 0.3 mV (Typ.), 7 mV (Max) |
| Bandwidth | 15 kHz |
| Recommended Spot Sized | Ø0.2 mm to Ø7 mm |
| Maximum Spot Sizee | Ø9 mm |
| Supply Voltage Requirement | ±5VDC ± 5%, 35 mA |
| Operating Temperature | 10 to 40 °C |
| Storage Temperature | -20 to 80 °C |
| Physical Specifications | |
| Sensor Size (Active Area) | 9 mm x 9 mm (0.35" x 0.35") |
| Sensor Depth | 3.05 mm (0.12") |
- Resolution is dependent on input optical power. Specification assumes photocurrent is 40 µA.
- Across whole 15 kHz bandwith of detector.
- The difference between the physical center and electrical center of the detector.
- Spots smaller than Ø0.2 mm could increase the position detector error.
- Specified by the active area of the pincushion.
| Item # | PDQ80A | PDQ30C |
|---|---|---|
| Substrate | Si | InGaAs |
| Wavelength Range | 400 to 1050 nm | 1000 to 1700 nm |
| Sensor Size | Ø7.8 mm | Ø3.0 mm |
| Gap Size | 42 μm | 45 µm |
| Detector Bandwidth | 150 kHz | |
| Responsivity | 0.4 A/W @ 633 nm | 1 A/W @ 1630 nm |
| Transimpedance Gain | 10 kV/A | |
| Breakdown Voltage | 15 V | 10 V |
| General Specifications | ||
|---|---|---|
| Clear Aperture | Ø0.50" (Ø12.7 mm) | |
| Aperture Thread | Internal SM05 (0.535"-40) | |
| Housing Dimensions | 2.00" x 1.20" x 0.65" (50.8 mm x 30.5 mm x 16.5 mm) |
|
| Mounting Thread | 8-32, 0.25" Min Thread Depth | |
| Metric Adapter | External 8-32 to Internal M4 Adapter (Item # AS4M8E) |
|
| Cable Length (Typical) | 5' (1.5 m) | |
| Connector (Plug) | Hirose HR10A-7P-6P | |
| Mating Receptacle | Hirose HR10A-7R-6S | |
| Weight | 0.25 lbs (114 g) | |
GRAPHS
Click to Enlarge
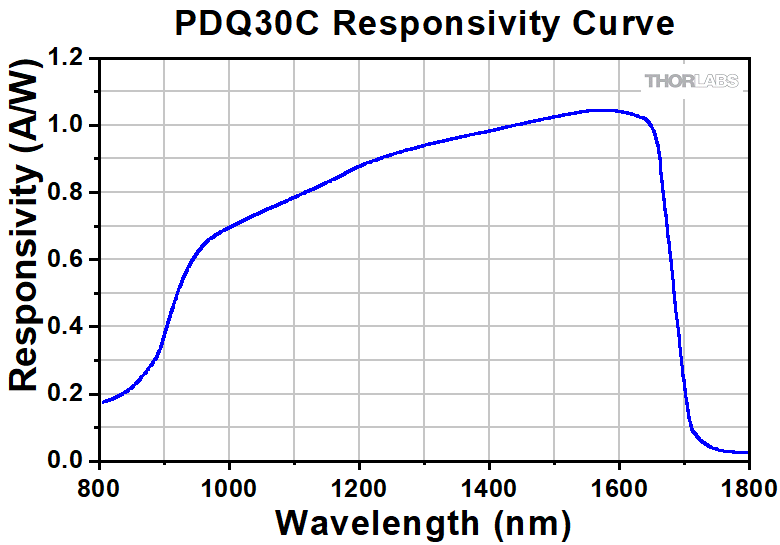
Responsivity Curve as a Function of Wavelength for the PDQ30C Segmented Quadrant Position-Sensing Detector

Click to Enlarge
Responsivity Curve as a Function of Wavelength for the PDQ80A Segmented Quadrant Position-Sensing Detector
 Click to Enlarge
Responsivity Curve as a Function of Wavelength for the PDP90A Lateral Effect Position-Sensing Detector
OPERATION
2D Lateral Effect Position-Sensing Detectors
Overview
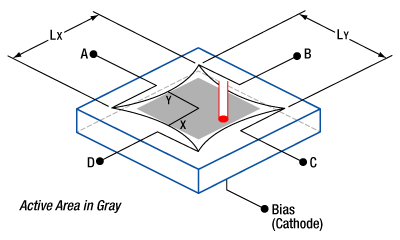
Figure 4.1 Lateral Effect Sensor Diagram
The 2D lateral effect sensor provides an accurate way to measure displacement - movements, distances, or angles – as well as feedback for alignment systems such as mirror control, microscope focusing, and fiber launch systems. These sensors work by proportionally distributing photocurrent using resistive elements to determine position and are usually referred to as lateral effect sensors. There are two different types of lateral effect sensors: duo lateral and tetra lateral.
Duo lateral sensors provide a resistive layer on both the anode and cathode photodiode connections. This isolates the x and y positional information of the sensor and allows the sensor to be highly linear and very accurate. However, the added resistive layers significantly increase manufacturing cost.
Tetra lateral sensors, such as the PDP90A, use a single resistive layer with a common cathode and an anode on each side of the detection area. This makes them very inexpensive to manufacture; however, the linearity decreases as the spot moves away from the center. This is caused by the physical location of the anodes along the sides of the sensor, specifically in the corners where the anodes approach each other. Thorlabs uses a variation of the tetra lateral sensor commonly called a “pin cushion” sensor, a diagram of which is shown in Figure 4.1. This sensor moves the anodes to the four corners of the sensors, reshaping the sensor area to produce linearity comparable to a duo lateral sensor at a significantly lower cost.
Calculating the Position
The PDP90A includes circuitry to decode the Δx, Δy, and SUM signals as follows:
From these formulas, the actual distances can be calculated with the following equations:

where x and y are the distances from the center of the sensor to the light beam's position, and Lx and Ly are the resistance lengths of the sensor. For the PDP90A sensor, Lx = Ly = 10 mm. Note that the resistance lengths are not the same as the active area. The active area is depicted by the gray region in Figure 4.1.
Positional Errors
Unlike quadrant style photodiodes, lateral effect sensors are independent of beam shape and size. They will provide positional information of the centroid of the spot as long as the light is located on the sensor. If part of the light moves off the sensor, it will cause a shift in the centroid, making the beam measurement unreliable.
Positional errors will also be caused by ambient light levels. For best results, the PDP90A should be operated in a dark location. However, light baffling using lens tubes and irises to narrow the field of view (FOV) will limit ambient light level errors.
Position Resolution
Position resolution is the minimum detectable displacement of a light spot incident on the position-sensing detector. Position resolution (ΔR) is a function of both the resistance length (Lx or Ly), or the x and y length, and the signal to noise ratio (S/N). The signal to noise ratio for this system can be defined as the SUM output signal level (Vo) divided by the output voltage noise (en). The PDP90A output noise is <2 mVpp, or <300 µVrms.

where,
ΔR is the resolution,
Lx is the resistance length,
en is the output noise voltage, and
Vo is the SUM output voltage level.
For the PDP90A:
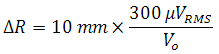
For best results, Vo should be maximized to 4 V, resulting in a position resolution of 0.750 µm. To do this, monitor the SUM output voltage of the sensor and adjust the optical intensity until the output is approximately 4 V. Increasing above 4 V will saturate the system, causing unreliable readings. The provided operational software will indicate the voltage level on a slide bar. If the SUM is saturated, the slide bar color will turn red. Back off the intensity until it switches to green. This will be equivalent to a 4 V SUM output.
Segmented-Quadrant Position Sensing Detectors
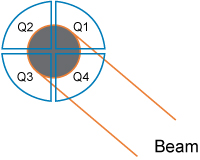
Figure 4.2 Segmented-Quadrant PSD Diagram
The segmented-quadrant position sensors consist of four distinct yet identical quadrant-shaped photodiodes that are separated by a ~0.1 mm gap and together form a circular detection area capable of providing a 2D measurement of the position of an incident beam. When light is incident on the sensor, a photocurrent is detected by each sector (labeled Q1, Q2, Q3, and Q4 as shown in Figure 4.2). From these signals, difference signals can be determined using an appropriate A/D converter. The sum of all four signals is also determined for normalization purposes. The normalized coordinates (X, Y) for the beam's location are given by the following equations.
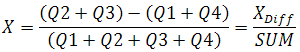
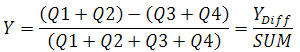
If a symmetrical beam is centered on the sensor, four equal photocurrents will be detected, resulting in null difference signals. Therefore, the normalized coordinates will be (X, Y) = (0, 0). The photocurrents will change if the beam moves off center, thereby giving rise to difference signals that are related to the beam displacement from the center of the sensor.
These sensors are very accurate and are ideal for auto-alignment applications. However, care should be taken in the shape and density distribution of the incident beam because these detectors are sensitive to both parameters. A beam that does not have a Gaussian intensity distribution will be centered based on the power rather than the geometric center of the beam. For these types of beams, a lateral sensor might be better suited.
PIN DIAGRAMS
PDP90A Pin Diagrams
Photodiode Detail

Female 6-Pin Hirose Connector, Detector Out

| Pin | Description |
|---|---|
| 1 | X-axis [A + D] - [B + C] |
| 2 | Y-axis [A + B] - [C + D] |
| 3 | SUM [A + B + C + D] |
| 4 | +Vsupply (+5 V) |
| 5 | Common |
| 6 | -Vsupply (-5 V) |
PDQ80A and PDQ30C Pin Diagrams
Photodiode Detail

Female 6-Pin Hirose Connector, Detector Out

| Pin | Description | |
|---|---|---|
| 1 | X-axis [Q2 +Q3] - [Q1 + Q4] | |
| 2 | Y-axis [Q1+Q2] - [Q3 + Q4] | |
| 3 | SUM [Q1 +Q2 + Q3 + Q4] | |
| 4 | +5 V to +15 V | |
| 5 | Common | |
| 6 | -5 V to -15 V | |
APPLICATION IDEA
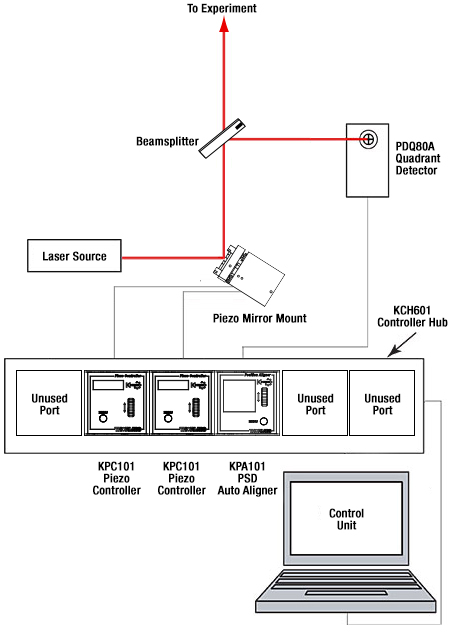
Figure 6.2 Typical Auto-Alignment Schematic
Example Auto-Alignment Setup
A basic auto-alignment schematic is shown in Figure 6.2. It consists of a PDQ80A Photodiode Sensor, a KPA101 Beam Position Aligner, two KPC101 Piezo Controller and Strain Gauge Readers, a previous-generation ASM003 two-axis piezo mirror mount (alternative mounts can be found here), a laser source, and a computer. Together, the system is used to position and maintain the laser beam so that it is located at the center of the detector array with respect to the beam's power density.
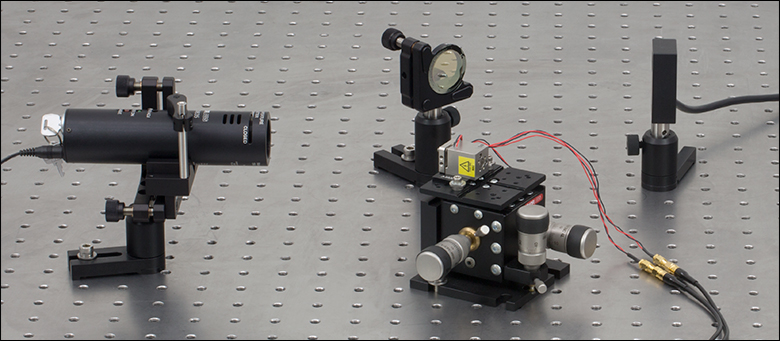
Click to Enlarge
Figure 6.1 Example Auto-Alignment Setup
The experimental setup shown in Figure 6.1 was created based on Figure 6.2. An LDM635 red laser diode module emitting at 635 nm serves as the laser source. The light is incident on a previous-generation ASM003 turning mirror mount, which is mounted on an MBT616D flexure stage (center of Figure 6.1). The turning mirror's X and Y motions are controlled using two KPC101 units (not shown). Please note that the piezo elements are meant for small beam alignment adjustments. The turning mirror directs light to a BP150 pellicle beamsplitter. The light transmitted by this beamsplitter will continue on to the rest of the experimental setup (not shown) while the reflected light is directed towards the PDQ80A Quadrant Sensor (right of Figure 6.1), which is controlled by the KPA101 Auto-Aligner (not shown).
SUGGESTED LASERS
When using a Quadrant Detector, choosing an appropriate alignment laser, such as the KLS635 or KLS1550, is essential. The laser's wavelength, beam diameter, and power all have a significant effect on the performance of the system. While there are countless sources that are suitable for use with our quadrant detectors, the lasers and optical components below have been selected for their cost-effectiveness and ease of use.
Photodiodes, such as those used in our quadrant detectors, should have less than 1 mW of incident light on them for linear responsivity. Beam splitters are commonly used in auto-alignment systems and reduce the amount of light on the detector. Depending on the optical setup, the laser's power may need to be further reduced, which can be accomplished using the power adjustment wheel on our K-Cube® lasers.
The suggested fiber patch cables are each 2 m long and are matched to the fiber type in the laser source. While we offer many different collimators, the ones suggested here are part of our Adjustable Collimator line and provide an appropriately sized beam diameter for use with our Quadrant Detectors. The collimators can be mounted numerous ways, but the VC1(/M) is a versatile solution suitable for most applications.
PDQ80A Compatible:- Wavelength Range: 400 - 1050 nm
- Input Beam Diameter: 1 - 3.9 mm
- Max Incident Power (for Linear Response): 1 mW
| Laser | Description | Power Supply | Fiber (2 m Length) | Collimator |
|---|---|---|---|---|
| KLS635 | 635 nm, 8.0 mW Fiber-Coupled K-Cube Laser | KPS201 | P1-630A-FC-2 | CFC11P-A |
PDQ30C Compatible:
- Wavelength Range: 1000 - 1700 nm
- Input Beam Diameter: 0.2 - 0.5 mm
- Max Incident Power (for Linear Response): 1 mW
| Laser | Description | Power Supply | Fiber (2 m Length) | Collimator |
|---|---|---|---|---|
| KLS1550 | 1550 nm, 7.0 mW Fiber-Coupled K-Cube Laser | KPS201 | P1-SMF28E-FC-2 | CFC2-C |
PACKAGING

Click to Enlarge
Figure 8.2 PDP90A Packaging
![]()
Figure 8.1 Sustainability Stamp
In support of Thorlabs' company values, we are taking steps to implement more sustainable product packaging, including:
- Reducing the Weight of Packaging Materials
- Increasing the Usage of Recyclable Packing Materials
Thorlabs' sustainability initiative is aimed at waste minimization while still maintaining adequate protection for our products. By eliminating any unnecessary packaging, implementing packaging design changes, and utilizing eco-friendly packaging materials for our customers when possible, this initiative seeks to improve the environmental impact of our product packaging. Figure 8.2 demonstrates the use of recycled paper in place of plastic bubble wrap in this product line. For more information on our efforts toward a greener future, please visit our Sustainability page.
Lateral Effect Position Sensor
| Item # | PDP90Aa |
|---|---|
| Material | Si |
| Wavelength Range | 320 to 1100 nm |
| Resolution, @ 635 nm | <0.75 µm @ 100 µW, <7.5 µm @ 10 µW |
| Recommended Spot Size | Ø0.2 to Ø7 mm |
 Click to Enlarge
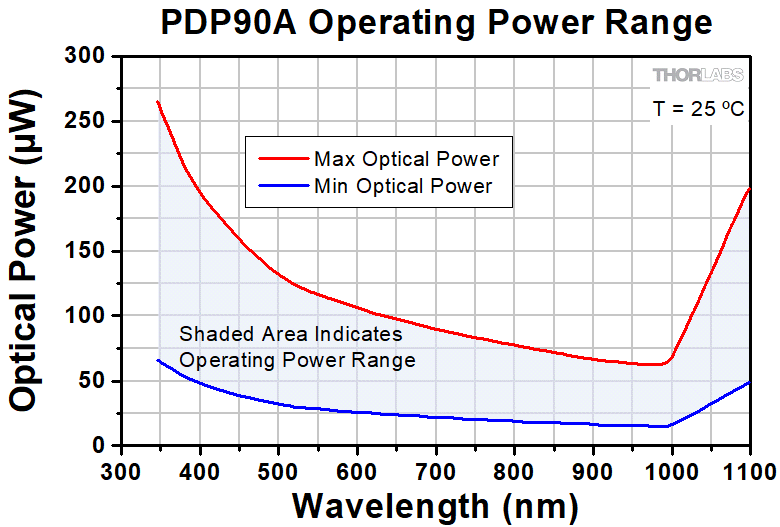
Figure G1.1 The shaded area in this chart shows the min and max input power levels as a function of wavelength. Make sure the incident beam power is as close to the max level for the best resolution and noise figure possible. Going over the max level will saturate the sensor and give erroneous results.
- Lateral Effect Position-Sensing Detector
- Insensitive to Beam Shape and Power Density
- Compatible with SM05 (0.535"-40) Lens Tubes
The PDP90A Position Sensor utilizes a silicon photodiode-based pincushion tetra lateral sensor to accurately measure the displacement of an incident beam relative to the calibrated center. These devices are ideal for measuring the movement of a beam, the distance traveled, or as feedback for alignment systems.
The large detection surface allows a beam diameter of <9 mm; however, our recommended range is 0.2 to 7 mm. Unlike quadrant sensors, which require overlap in all quadrants, the lateral sensor provides positional information of any spot within the detector region, independent of beam shape, size, and power distribution. The PDP90A has a very low noise figure of <2 mVpp (<300 µVrms), which corresponds to a detection error of 0.750 μmrms. Resolution is directly related to the optical input power by the following equation:
where
ΔR is the Resolution,
Lx is the resistance length, 10 mm,
en is the output noise voltage, <300 µVrms, and
Vo is the SUM output voltage level, 4 V max.
Therefore, at the maximum power level, the resolution is 0.75 µm. More detailed technical information can be found in the Operation tab.
Each PDP90A lateral position-sensing detector is packaged with an 8-32 to M4 adapter to provide compatibility with either imperial or metric mounting posts.
Controller
The PDP90A is compatible with the KPA101 controller, available separately below.
Part Number | Description | Price | Availability |
|---|---|---|---|
PDP90A | 2D Lateral Effect Position Sensor, 320 to 1100 nm | $493.18 | Today |
Quadrant Position Photodiode Detectors
| Item # | PDQ80Aa | PDQ30Ca |
|---|---|---|
| Material | Si | InGaAs |
| Wavelength Range | 400 - 1050 nm | 1000 - 1700 nm |
| Detector Bandwidth | 150 kHz | 150 kHz |
| Recommended Spot Size | Ø1.0 to Ø3.9 mm | Ø0.2 to Ø0.5 mm |
- Segmented Quadrant Position-Sensing Detector
- Options Available for 400 - 1050 nm or 1000 - 1700 nm
- Ideal for Automatic Alignment
- Compatible with Four Channel Position Sensing System or a Single Channel K-Cube®
- Compatible with SM05 (0.535"-40) Lens Tubes
The PDQ80A and PDQ30C detectors are segmented, position-sensing, quadrant detectors for precise path alignment of light in the 400 to 1050 nm or 1000 to 1700 nm range, respectively. A 6-pin Hirose connector on each detector outputs signals proportional to the incident beam's power distribution (and thus position). For best results, quadrant detectors should be used with powers under 1 mW (linear regime of sensor) and beam diameters within their specified range. More detailed technical information can be found in the Operation tab.
Each quadrant detector is packaged with an 8-32 to M4 adapter to provide compatibility with either imperial or metric mounting posts.
Thorlabs offers a wide variety of coherent light sources compatible with both quadrant detectors. A selection of appropriate lasers is outlined in the Suggested Lasers tab. For questions about specific light detection arrangements, contact Tech Support.
Controller
The PDQ80A and PDQ30C are compatible with the KPA101 controller, available separately below.
Part Number | Description | Price | Availability |
|---|---|---|---|
PDQ80A | Quadrant Detector Sensor Head, 400 to 1050 nm | $622.81 | Today |
PDQ30C | Quadrant Detector Sensor Head, 1000 to 1700 nm | $1,030.85 | Today |
K-Cube® Position Sensing Detector (PSD) Auto Aligner
| Item # | KPA101 |
|---|---|
| X & Y Difference Outputs | -10 to 10 V, SMA Connectors |
| Sum Output | 0 to 10 V, SMA Connector |
| Quadrant Detector Input | 6-Pin Hirose Connectora |
| Closed-Loop Bandwidth | Up to 1 kHzb |
| Monitor Mode Bandwidth (-3.0 dB) | 100 kHz |
| Dimensions (W x D x H) | 60.0 mm x 60.0 mm x 49.2 mm (2.36" x 2.36" x 1.94") |
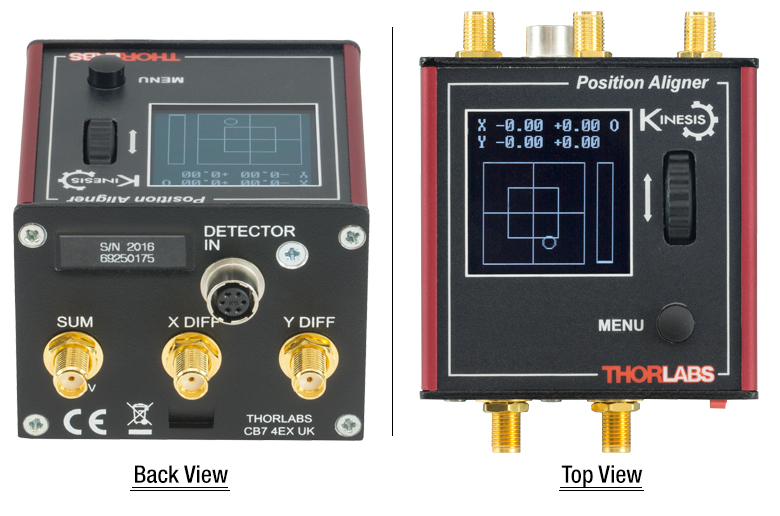
Click to Enlarge
Figure G4.1 Back and Top Views of the KPA101 K-Cube
(See the Full Web Presentation Here for More Information)
- Auto Alignment of Beam to Center of Sensor when in Closed-Loop Mode
- Beam Position Measurement when in Open-Loop Mode
- OLED Menu and Position Display for Complete On-Unit Control
- Voltage Outputs for Sum, Difference, and Feedback Signals
- Full Kinesis® Software Control Suite (See Full Web Presentation for Details)
- Software Compatible with other Kinesis Controllers for Integrated
Systems Development - Multi-Axis Expansion Using Ethernet and USB Controller Hubs (Sold Separately)
- Magnetic, Clip-On Optical Table Mounting Adapter Included
The KPA101 K-Cube® Beam Position Aligner is designed for use with our range of Quadrant and Lateral Effect Sensor Heads. It features a top-mounted control panel with an OLED screen for on-unit control and position readouts. The OLED display includes a backlight that can be dimmed or turned off using the top panel menu options. The front of the unit contains two bidirectional trigger ports that can be used to read a 5 V external logic signal or output a 5 V logic signal to control external equipment. Each port can be independently configured to control the logic level or to set the trigger as an input or output.
The unit is fully compatible with our Kinesis software package. Please note that this module does not ship with a power supply. Compatible power supplies are listed below.
Operation
The KPA101 K-Cube can be controlled by the manual interface on the top of the unit or via a USB connection to a computer running our Kinesis software package. The Kinesis interface allows the auto aligner to be operated in either an open- or closed-loop mode. In both modes, the K-Cube generates a left-minus-right X difference (X DIFF) signal, a top-minus-bottom Y (Y DIFF) difference signal, and a sum (SUM) signal that are displayed on the target screen.
When in open-loop mode, the X DIFF and Y DIFF difference signals shown on the target screen are not output to the SMA connectors on the back of the unit. Instead, the X DIFF and Y DIFF SMA outputs, which represent X OUT and Y OUT position demand signals, will be fixed at zero or the last closed-loop value. This mode allows for manual alignments on the detector. Once roughly aligned, the unit can be set to closed-loop mode to begin automated alignments of the system.
In the closed-loop mode, a DSP processor inside the KPA101 runs two independent feedback loops that output X DIFF and Y DIFF position demand signals. These signals will be present at the SMA connectors on the back of the unit for use as the inputs to the beam steering elements being used to center the beam on the detector. The proportional, integral, and differential (PID) constants can be adjusted to fine tune the response of the feedback loops to changes in the target position. Floating-point arithmetic allows for a greater range of PID coefficients to be used in the control loop, resulting in higher precision and lower noise (see Appendix B of the manual for details). This increases the range of actuators that can be stabilized using the auto aligner. Furthermore, the unit incorporates a notch filter that can be used to counteract the natural resonance of the specific mechanical system in which the unit is being used. This can stabilize actuators that are prone to mechanical resonances, such as piezo mirror gimbal mounts.
When the unit is controlled via the USB interface, the open-loop output of the unit is also exported digitally to the computer. Please note that stable closed-loop operation can only be achieved with continuous wave (CW) lasers. The KPA101 K-Cube is not recommended for use with pulsed lasers.
For more information on the KPA101, please see the full web presentation here.
Part Number | Description | Price | Availability |
|---|---|---|---|
KPA101 | K-Cube PSD Auto Aligner (Power Supply Sold Separately) | $1,042.02 | In Stock Overseas |
KAP101 | Adapter Plate for KEH Series Hub and 60 mm Wide T-Cubes | $74.29 | Today |
KEH6 | NEW! Ethernet and USB Controller Hub and Power Supply for Six K-Cubes | $800.00 | Today |
TPS002 | ±15 V/5 V Power Supply Unit with Mini-DIN Connectors for up to Two K- or T-Cubes | $137.27 | Today |