 Products Home / Technical Resources / Insights / Lab Practices Insights / Measure the Faraday Effect and Calculate the Verdet Constant of a Sample
Measure the Faraday Effect and Calculate the Verdet Constant of a Sample


Please Wait
How can the strength of a material's Faraday effect be measured?
Since the Faraday effect causes the polarization state of light to rotate as it propagates through a material in the presence of a magnetic field, one approach to determining the effect's strength in a material is to input linearly polarized light, apply a strong magnetic field through the material, and observe the induced change in the orientation of the output polarization state. It is not necessary to directly measure the output polarization state to determine the change in its orientation. Instead, the output light can be analyzed by measuring the optical power transmitted through a rotating linear polarizer. The measured power oscillates with a phase dependent on the orientation of the linear polarization state incident on the rotating polarizer. This was demonstrated using a CdMgTe crystal. Measurements of light output from the crystal were used to calculate its Verdet constant, which characterizes the strength of a material's Faraday effect.
Click to Enlarge
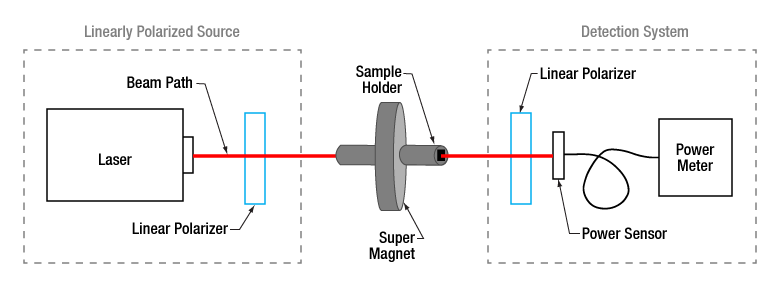
Figure 1: Faraday effect measurements can be made with the sample placed between a linearly polarized light source and a polarization-sensitive detection system. The CdMgTe crystal was approximately a third of the length of the annular magnet's bore, and the plastic sample holder was used to position and immobilize the crystal at the center of the bore. In the detection system, the optical power sensor was placed as close as possible to the output side of the linear polarizer, which was installed in an indexed rotation mount. An advantage of this setup is that it requires minimal alignment.
Click to Enlarge
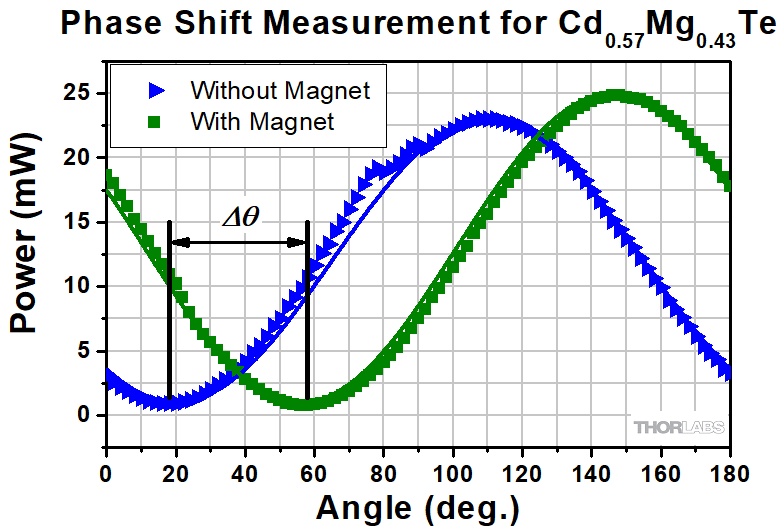
Figure 3: Optical power measurements were made while rotating the detection polarizer's transmission axis in 2° increments. Data were acquired with the magnet out of (triangles) and in (squares) the setup. Malus' law (solid lines) was used to model a to fit each curve. The phase shift
Click to Enlarge
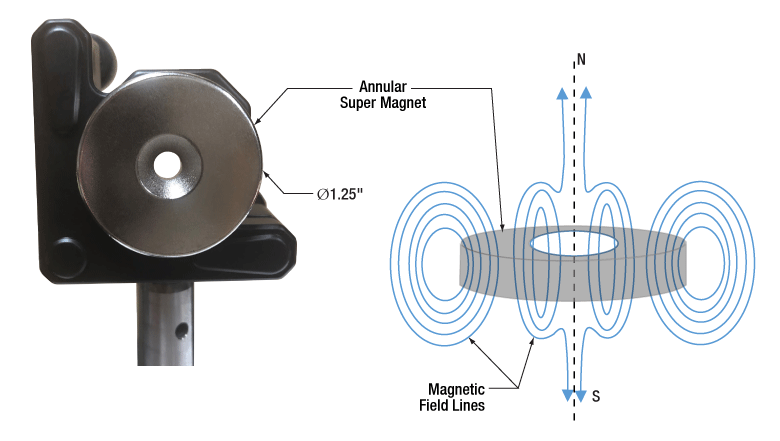
Figure 2: The crystal under test was placed in the bore of the annular magnet (left). The 2.2 mm long crystal was positioned in the center of the 6.35 mm long bore, where the magnetic field was strongest, most uniform, and directed along the N-S axis (right).
| Curve Fit to Data Acquired Without Magnet |
Curve Fit to Data Acquired With Magnet |
Faraday Rotation (Δθ ) |
 |
 |
 |
Faraday Rotation
The rotation of the polarization state due to the Faraday effect is called the Faraday rotation, which is directly proportional to both the magnetic field strength (B ) in the material and the physical distance (L ) the light propagates through the material in the presence of the field. The proportionality constant is called the Verdet constant (V ).
This intrinsic material parameter, which is wavelength and temperature dependent, characterizes the strength of the material's Faraday effect. When the Verdet constant is known, the Faraday rotation (Δθ ),

due to different magnetic field strengths and material lengths can be calculated. One approach to obtaining the Verdet constant is to measure the Faraday rotation for a specific material length and a known magnetic field strength.
Faraday Effect Measurement
Using this approach, and the setup illustrated in Figure 1, the strength of a CdMgTe crystal's Faraday effect was measured.
The linearly polarized light source consisted of a collimated fiber-coupled laser whose 785 nm emission was transmitted through a fixed linear polarizer.
An annular super magnet was used in order to provide a magnetic field strong enough to induce a measurable Faraday rotation. The crystal was mounted in the center of the magnet's bore, as that is where the magnetic field is the strongest (Figure 2).
The light output from the crystal was transmitted through a second linear polarizer, which was secured in an indexed rotation mount, and to a power sensor. The power sensor was positioned as close as possible to the output side of the linear polarizer.
Two measurement sets were acquired, one with, and the other without, the magnet in the setup. Each data set (Figure 3) recorded average power measurements taken at 2° increments of the second linear polarizer's transmission axis angle. The curves oscillate with the same period but are phase shifted
Calculate the Verdet Constant
The phase shift between the two curves plotted in Figure 3 is related to the Faraday rotation. As is described in a separate Insight, it is in general necessary to add a factor of  to the phase shift to obtain the Faraday rotation. In this case, that factor is equal to zero and the phase shift equals the Faraday rotation.
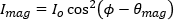
The phase shift can be determined after each data curve is fit using Malus' law,
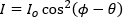 ,
,
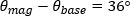
in which Io is the intensity of the incident light and  is the angle of the second linear polarizer's transmission axis. The fit parameter (θ ) is a constant that was optimized individually (θbase and θmag , respectively, in the table) for each data set. The difference in the two fit parameters is the Faraday rotation (36°). Using this Faraday rotation value, the Verdet constant can be calculated,

The magnetic field strength (B ) was 5800 Gauss at the center of the magnet's bore, the crystal's length (L ) was 0.22 cm, and the Faraday rotation angle
|
Looking for more Insights? |
Content contributed by and based on work performed by Zoya Shafique. |
| Posted Comments: | |
| No Comments Posted |