 Products Home / Technical Resources / Electro-Optic Modulator Technical Publications / Fiber-Coupled Electro-Optic Modulator Lab Facts
Fiber-Coupled Electro-Optic Modulator Lab Facts

Please Wait


Driving an Electro-Optic Phase Modulator with the Amplified Output of a Function Generator
Click to Enlarge
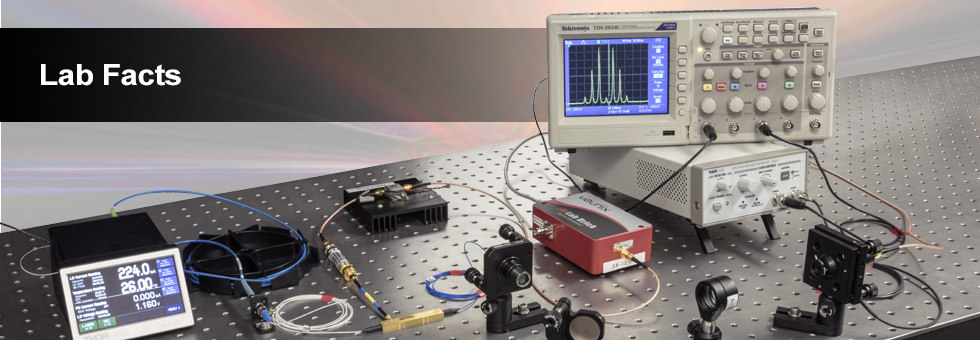
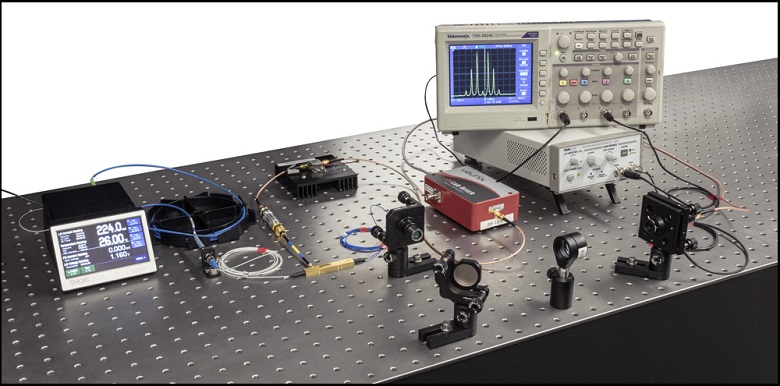
Figure 1: Experimental Setup Used to Evaluate Whether a Basic RF Source Built Around a Function Generator Could be Sufficient to Drive a Fiber-Coupled EO Phase Modulator
Thorlabs offers a selection of fiber-coupled electro-optic (EO) modulators, which are ideal for modulating light from fiber-coupled laser sources. Applications frequently require EO modulators to be driven at rates of 1 GHz or higher, which places significant demands on the driving radio frequency (RF) voltage source. We investigated whether it would be possible to use a basic setup built around a function generator to drive a fiber-coupled EO phase modulator. The experimental setup we designed and implemented to test this possibility included instrumentation to record the spectrum of the modulated optical signal. By analyzing the modulated optical spectrum, we confirmed this basic RF source is a viable option for driving a fiber-coupled EO phase modulator. Our approach and results are documented in this Lab Fact.
Experimental Design and Setup
The design of the RF voltage source portion of the setup required first determining the power the RF source should supply to drive the fiber-coupled EO phase modulator. The power requirements were calculated after we made an estimate of the driving voltage needed to achieve the modulation depth desired for this application. Details describing our process for selecting a modulation depth, the relationship between modulation depth and driving voltage, and the calculations we used to estimate the power required from the RF voltage source are included in the Lab Facts document. From our investigations, we determined the power from the function generator alone would not be sufficient for our application. Our solution was to insert a low noise amplifier between the function generator and EO modulator. We also included an electrical low pass filter before the modulator to remove signal distortion that appeared to originate with the function generator. We drove the EO phase modulator with a sinusoidal RF voltage, which imparted a sinusoidal phase modulation on the 1550 nm CW laser signal.
A scanning Fabry-Perot interferometer, whose output was sent to an oscilloscope, was placed after the EO phase modulator and used to measure and monitor the spectrum of the modulated optical signal. It was necessary to use the Fabry-Perot interferometer for this purpose as it has the ability to resolve the very fine spectral features of the phase-modulated optical spectra: at a wavelength of 1550 nm, a frequency difference of 1 GHz is equivalent to a wavelength difference of 0.8 pm. The measured spectra were recorded as functions of scan time. In the Lab Facts document, we describe a straight-forward method to convert from units of Fabry-Perot scan time to units of relative optical frequency. For this work, we estimate Δf = (1.17 GHz/ms)Δt.
Experimental Results
As is described in the Lab Facts document, theory predicts the spectra of our phase modulated optical signals would include sets of symmetric sidebands arranged around the laser carrier peak at frequency fo. The sidebands are displaced from the laser carrier peak frequency at integer multiples of the modulation frequency fm (fo ± Nfm with N = 1, 2, ...). The relative heights of the sidebands are a function of the modulation depth, which is in turn a function of the peak-to-peak value of the RF driving voltage. Given the modulation depth, the relative amplitudes of the laser carrier peak and modulation sidebands can be calculated. This makes it possible to tailor the power distribution across the various peaks to meet an application's needs. We used the predictive power of this model to confirm our RF source was adequately driving the EO modulator.
The spectra shown in Figures 2 and 4 are representative of the modulation spectra we measured. The theoretical curves in Figure 3 are a function of modulation depth and plot the expected relative powers of the laser carrier peak (solid red curve), first order sidebands (dotted blue curve), second order sidebands (dotted green curve), and third order sidebands (dotted violet curve). The black arrow points to the modulation depth corresponding to the spectrum in Figure 2, and the gray arrow points to the modulation depth corresponding to the spectrum in Figure 4. From our results, we determined our measured and applied modulation frequencies agreed, and we confirmed the spectral power distributions in our optical spectra were consistent with the peak-to-peak driving voltage of the RF source. We conclude that the good agreement between the expected and recorded results validates the use of a basic RF source built around a function generator as a driver for fiber-coupled EO phase modulators.

Click to Enlarge
Figure 4: EO Phase Modulator Spectrum When Vpp = 3.63 V
The carrier frequency is fo; the modulation frequency is fm = 1 GHz. The X-axis reports the scanning time of the Fabry-Perot interferometer and can be directly related to the signal's relative frequency spectrum.
Click to Enlarge
Figure 3: Curves Relating the Power in the Carrier and Several Sideband Peaks as A Function of Modulatrion Depth
The 0.44 modulation depth indicated by the black arrow corresponds to Figure 2, and the 0.56 modulation depth indicated by the gray arrow corresponds to Figure 4.
Click to Enlarge
Figure 2: EO Phase Modulator Spectrum When Vpp = 2.85 V
The carrier frequency is fo; the modulation frequency is fm = 1 GHz. The X-axis reports the scanning time of the Fabry-Perot interferometer and can be directly related to the signal's relative frequency spectrum.
| Posted Comments: | |
| No Comments Posted |